It was a shocker in September 2023 when W. P. Carey Inc. (NYSE:WPC) unveiled its plan to optimize the portfolio by making some tough choices in the near term.
The strategy hinges on a significant revamp of its non-core office assets, coupled with a ~20% slash in dividends to shore up the balance sheet and enhance valuation.
The dividend cut caught many investors off-guard, prompting a mass exodus from the stock, including passive funds tracking dividend compounders.
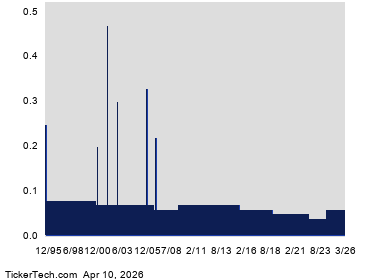
We witnessed the market’s harsh response in September, as depicted in the performance comparison chart between WPC and the broader REIT index.
The Purpose of the Article
Before WPC’s strategic shift, many investors viewed the Company as a strong contender for the coveted dividend aristocrat status, akin to the characteristics of Realty Income Corporation (NYSE:O). The dividend history of WPC provided reassurance to investors, mirroring the stability observed in Realty Income Corporation.
Given the similarities between WPC and O, income-oriented investors, including myself, may wonder whether Realty Income is susceptible to the same forces that prompted WPC to reevaluate its strategy and dividend policy.
I’d like to juxtapose Realty Income with WPC on the three primary factors that justified WPC’s dividend reduction. It’s worth noting that WPC’s portfolio statistics and data reflect the pre-restructured portfolio as of 3Q23.
#1- Defensive Portfolio Placement
Fundamentally, WPC has strategically positioned its real estate assets in segments that inherently offer greater stability and growth potential compared to Realty Income.
About half of WPC’s ABR is derived from industrial/warehouse properties, which currently enjoy secular tailwinds and present more attractive NOI growth prospects than conventional retail properties – an area where Realty Income has concentrated its holdings.
In addition to industrial/warehouse properties, WPC also possesses significant exposure to the retail and office sectors, where Realty Income has also allocated capital, albeit primarily in the retail space.
WPC’s holdings in struggling office properties somewhat diminish the overall portfolio quality. However, it’s vital to note that this segment accounts for roughly 16% of the total ABR, which is relatively insignificant on a standalone basis and doesn’t imperil WPC’s ability to cover the dividend. Of WPC’s total ABR, approximately 16% is generated from triple net lease retail properties, the primary focus of O.
The remainder (10%) comprises various property types such as education facilities, laboratories, hotels (net lease), research and development, specialty, fitness facilities, student housing (net lease), theater, funeral home, restaurant, land, parking, and outdoor advertising – with no concealed risks that could collectively render WPC’s portfolio less attractive than O’s retail exposure.
Conversely, Realty Income features an overwhelming bias toward retail properties, constituting about ~82.5% of the total ABR, with only 13% allocated to industrial properties. WPC’s strategically defensive assets account for half of its portfolio, providing superior performance in comparable store ABR growth over the past four quarters.
#2 Balance Sheet Stability
Comparing REITs O and WPC: The Delicate Dance of Debt and Dividends
Debt Maturity Profile: A Tale of Two REITs
Peeling back the layers of these REITs’ investment-grade balance sheets reveals a nuanced picture, and a slender edge for O. While both WPC and O report net debt to EBITDA ratios at 5.7x and 5.2x, respectively, the critical disparity lies in the debt maturity profile. WPC faces front-end loaded debt maturities, triggering potentially unfavorable repricing of substantial portions of outstanding debt. The consequence? A hike in debt costs from the current ~3% levels. WPC’s journey toward unpleasant refinancing has already begun, a situation set to worsen in 2025 and 2026, as depicted in the debt maturity graph below.
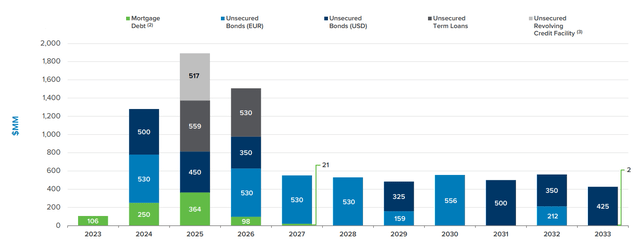
Contrarily, O’s debt maturities, with ~$1.8 billion due in 2024 and ~$1.1 billion in 2025, are lighter. This strategic spread curtails the impact of the uncertain interest rate environment, offering respite from the currently restrictive SOFR levels.
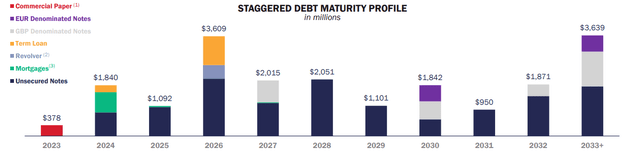
In summary, without securing fresh capital to pay down this and next year’s debt maturities, WPC would face significant downward pressure on its capacity to uphold dividends. O, on the other hand, has judiciously staggered its debt financings, proving advantageous amidst the expensive cost of capital.
FAD Payout and AFFO: Unraveling the Distinctions
Both WPC and O exhibit a similar TTM FAD payout at approximately 78% and 75%, respectively. However, assessing this metric in terms of AFFO paints a disparate picture. While O’s payout level remains constant, WPC’s breaches a rather elevated ~87% on a TTM basis. The AFFO, a more accurate reflection of cash flows by adjusting non-cash items that inflate earnings without contributing to cash generation, exposes WPC’s risky practice of distributing almost 90% of its cash.
This aggressive payout, coupled with challenges in the office sector (representing ~16% of WPC’s ABR) and imminent refinancings causing increased interest costs, lends validity to the communicated dividend cut. O, conversely, maintains a more conservative AFFO distribution level and a debt maturity profile that shelters it from major headwinds up to 2026. Moreover, O’s minimal exposure in the office segment minimizes impact on cash generation.
The End Game: Dividends and Debt Management
WPC’s recent dividend reduction can be attributed to its exhaustive AFFO payout, limited margin of safety, struggles in the office segment, and an impending debt maturity wall, rendering its AFFO payout unsustainable. However, with the anticipated proceeds from the office portfolio sale, WPC aims to retire significant portions of near-term maturities, alongside a strategic shift towards warehouse/industrial properties, setting the stage for sustainable dividend growth.
Investors in O, shielded from similar headwinds, benefit from a back-end loaded debt maturity profile, minimal exposure to the office space, and a safer AFFO payout level. While maintaining holdings in O, akin to WPC, seems prudent owing to shared characteristics such as net lease assets, long leases tied to CPI escalators, an investment-grade balance sheet, and a focus on dividends, a conservative approach may warrant a potential dividend revision if elevated SOFR persists until 2026 and beyond, coupled with fundamental challenges in the retail space impacting O’s occupancy rates and consequently inflating the already relatively high AFFO payout.