Looking at the underlying holdings of the ETFs in our coverage universe at ETF Channel, we have compared the trading price of each holding against the average analyst 12-month forward target price, and computed the weighted average implied analyst target price for the ETF itself. For the The Consumer Discretionary Select Sector SPDR Fund ETF (Symbol: XLY), we found that the implied analyst target price for the ETF based upon its underlying holdings is $200.58 per unit.
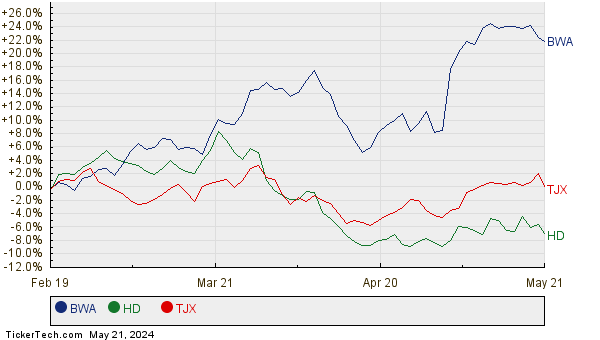
With XLY trading at a recent price near $177.37 per unit, that means that analysts see 13.09% upside for this ETF looking through to the average analyst targets of the underlying holdings. Three of XLY’s underlying holdings with notable upside to their analyst target prices are BorgWarner Inc (Symbol: BWA), Home Depot Inc (Symbol: HD), and TJX Companies, Inc. (Symbol: TJX). Although BWA has traded at a recent price of $36.87/share, the average analyst target is 16.12% higher at $42.81/share. Similarly, HD has 14.18% upside from the recent share price of $337.82 if the average analyst target price of $385.71/share is reached, and analysts on average are expecting TJX to reach a target price of $111.47/share, which is 13.99% above the recent price of $97.79. Below is a twelve month price history chart comparing the stock performance of BWA, HD, and TJX:

Combined, BWA, HD, and TJX represent 12.61% of the The Consumer Discretionary Select Sector SPDR Fund ETF. Below is a summary table of the current analyst target prices discussed above:
| Name | Symbol | Recent Price | Avg. Analyst 12-Mo. Target | % Upside to Target |
|---|---|---|---|---|
| The Consumer Discretionary Select Sector SPDR Fund ETF | XLY | $177.37 | $200.58 | 13.09% |
| BorgWarner Inc | BWA | $36.87 | $42.81 | 16.12% |
| Home Depot Inc | HD | $337.82 | $385.71 | 14.18% |
| TJX Companies, Inc. | TJX | $97.79 | $111.47 | 13.99% |
Are analysts justified in these targets, or overly optimistic about where these stocks will be trading 12 months from now? Do the analysts have a valid justification for their targets, or are they behind the curve on recent company and industry developments? A high price target relative to a stock’s trading price can reflect optimism about the future, but can also be a precursor to target price downgrades if the targets were a relic of the past. These are questions that require further investor research.
![]() 10 ETFs With Most Upside To Analyst Targets »
10 ETFs With Most Upside To Analyst Targets »
Also see:
TPCS Historical Stock Prices
STAB YTD Return
MSM Average Annual Return
The views and opinions expressed herein are the views and opinions of the author and do not necessarily reflect those of Nasdaq, Inc.


