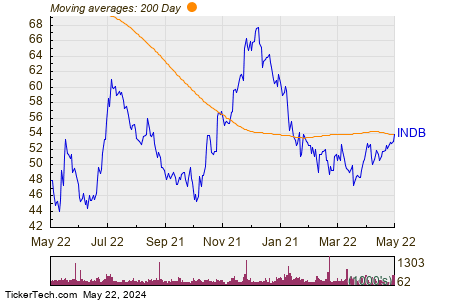
In trading on Wednesday, shares of Independent Bank Corp (Symbol: INDB) crossed above their 200 day moving average of $54.01, changing hands as high as $54.28 per share. Independent Bank Corp shares are currently trading up about 1.6% on the day. The chart below shows the one year performance of INDB shares, versus its 200 day moving average:

Looking at the chart above, INDB’s low point in its 52 week range is $43.283 per share, with $68.75 as the 52 week high point — that compares with a last trade of $54.06.
 Click here to find out which 9 other dividend stocks recently crossed above their 200 day moving average »
Also see:
ELVN Average Annual Return
IAC shares outstanding history
GNRX Options Chain
The views and opinions expressed herein are the views and opinions of the author and do not necessarily reflect those of Nasdaq, Inc.
5 Stocks Our Experts Predict Could Double In the Next Year
By submitting your email, you'll also get a free pivot & flow membership. A free daily market overview. You can unsubscribe at any time.