Recognizing Key Price Levels in Stock Trading
Understanding support and resistance levels crucial in financial markets.
FedEx Chart Highlights Price Level Dynamics
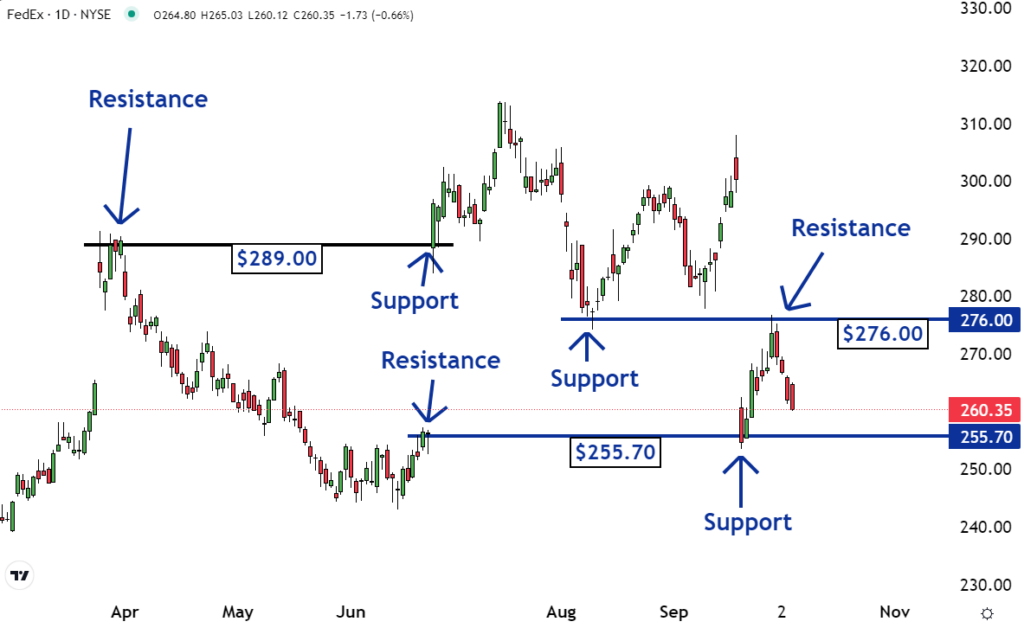
Analysis of FedEx’s ($FDX) chart reveals conversions between support and resistance levels.
FedEx stock chart exemplifies how support levels can convert into resistance and vice versa. For instance, $289 transformed from resistance to support in late June. Similarly, $255.70 turned from resistance to support in September.
Seller’s Remorse and Buyer’s Remorse Effects
Seller’s and buyer’s remorse play crucial roles in price level transformations. Investors who sell at resistance may regret if the price surges, triggering buy-back actions when it hits previous resistance levels, creating support. Conversely, those with buyer’s remorse may sell at support, aiming to break even when the price rebounds.

Utilizing Price Levels in Trading Decisions
Recognizing critical price levels aids traders in strategically placing buy and sell orders to potentially enhance profits.
Understanding market dynamics empowers traders and investors in making informed decisions in the stock market.


