Understanding Super Micro’s Price Shifts: Key Levels and Trading Insights
In the financial markets, trends often shift for specific reasons. Successful traders recognize these patterns and capitalize on them.
Experienced traders are aware that previously significant price levels can become relevant again. When a stock revisits these levels, it presents opportunities for low-risk trades.
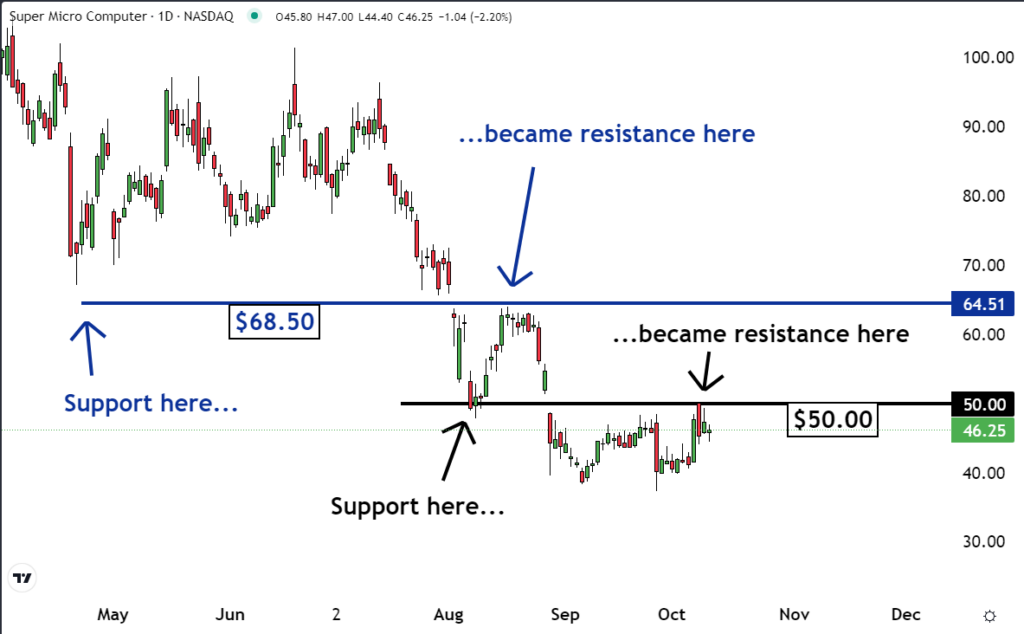
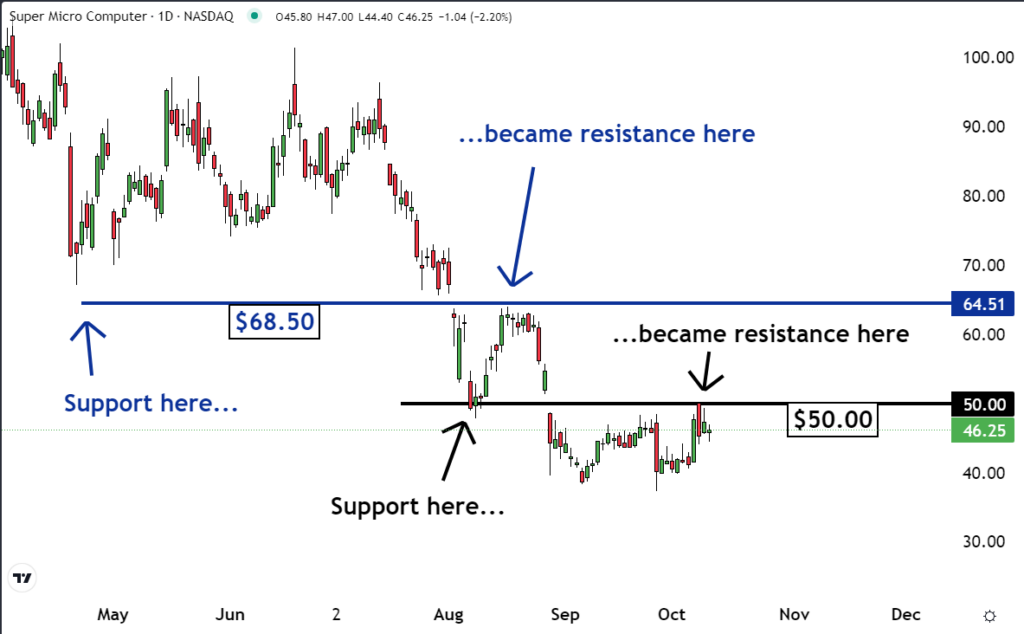
The case of Super Micro Computer, Inc. SMCI is telling. The $68.50 and $50 price points have shown importance in recent trading, prompting our team to select it as the Stock of the Day.
In August, Super Micro faced resistance at the $68.50 level, highlighting the significance of this benchmark. Recently, the shares encountered resistance again at the critical $50 level, marking a shift in trend.
Previously, these levels served as support.

Read Also: Peter Schiff Urges MicroStrategy Founder Micheal Saylor to ‘Borrow’ Another $4.3B to Buy Bitcoin as U.S. Plans to Sell: ‘Sometimes, the Government Does Something Smart’
It’s common for price levels that acted as support to transition into resistance. This occurs when traders regret their past purchases. After initially buying during a surge at support levels, they may begin to panic if the stock price drops.
These regretful buyers often decide to sell their shares at breakeven to avoid losses. If the stock returns to their purchase price, they will place sell orders, creating resistance at a previously supportive level.
For instance, in April, the $69.50 level was support for Super Micro, but by August, it became resistance. Similarly, the $50 level has now shifted from support to resistance.
Identifying these crucial price levels can serve traders well in their pursuit of profit. Observing these dynamics on Super Micro’s chart can lead to substantial gains.
Read Next:
• Elon Musk May Introduce Tesla’s Robotaxi, But Consumers Show Skepticism, New Study Indicates Need for Trust-Building
Photo: Shutterstock
Market News and Data brought to you by Benzinga APIs


