T-Mobile’s Q3 2024 Financial Outlook: Strong Growth Expected
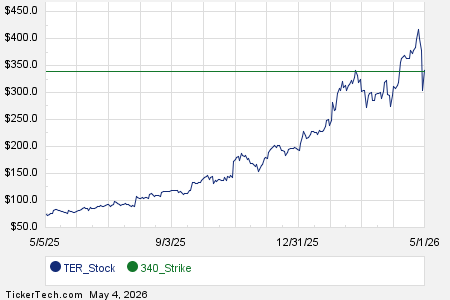
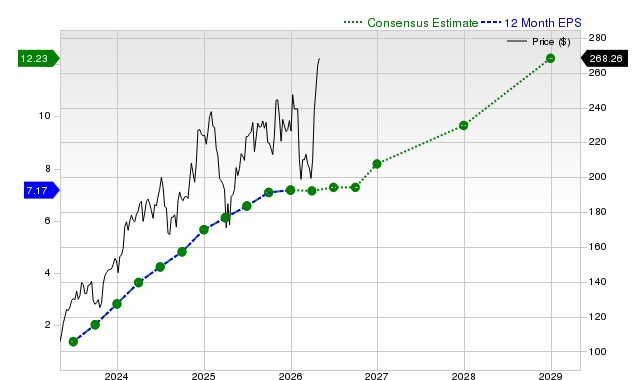
T-Mobile (NASDAQ:TMUS) is set to release its Q3 2024 earnings report at the end of October. The company’s stock has performed exceptionally well this year, rising approximately 35%, surpassing Verizon (NYSE:VZ), which has seen a 22% increase during the same timeframe. Analysts anticipate T-Mobile will post earnings of $2.44 per share, marking over a 30% rise from the previous year. Revenue is expected to reach $20.1 billion, about 4% higher than last year and aligning with consensus estimates. This growth is likely fueled by an increase in wireless service revenues, particularly due to more customers choosing higher-value 5G plans and maintaining steady subscriber growth. For further insights, see our detailed analysis of T-Mobile Earnings Preview.
In Q2 2024, T-Mobile led the industry in postpaid phone net additions, gaining 777,000 new connections—a second-quarter record for the company. We foresee robust net additions continuing into Q3, as T-Mobile captures a larger share of the U.S. wireless market, largely thanks to its strategic rollout of mid-band spectrum for 5G technology. Mid-band spectrum strikes a balance between speed and coverage, unlike the millimeter-wave spectrum that competitors Verizon and AT&T have focused on, which offers high speeds but limited coverage. Additionally, the recent launch of the iPhone 16 in mid-September is expected to bolster subscriber growth. T-Mobile has reported that the iPhone 16 is selling better in its initial sales week compared to the previous year, with an increased preference for the high-end Pro and Pro Max models. Furthermore, earlier price increases and a shift towards more premium plans could enhance per-user revenue for T-Mobile in this quarter. The company has also been making gains in the broadband market through its fixed wireless broadband service, using excess spectrum acquired in its Sprint merger. Last quarter, T-Mobile added 406,000 broadband subscribers, the highest in the industry, bringing its total broadband customer base to about 5.6 million. Improved profitability is anticipated as T-Mobile phases out old Sprint towers and finalizes the integration of both networks.
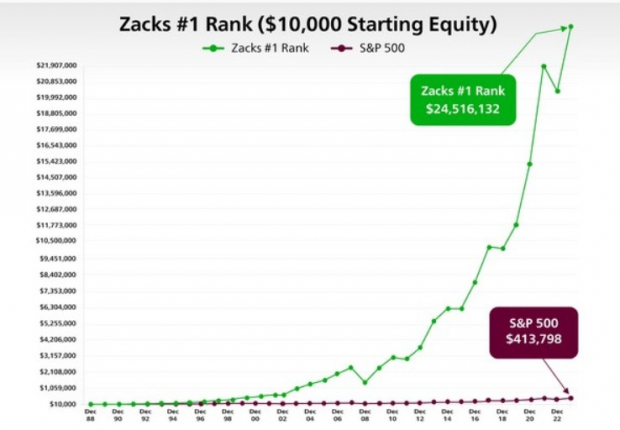
Throughout recent years, T-Mobile’s stock has outshined the broader wireless sector, although its returns have fluctuated significantly over the past four years. The stock saw a decline of 14% in 2021, but rebounded with gains of 21% in 2022 and 15% in 2023. In contrast, the Trefis High Quality (HQ) Portfolio, comprising 30 less volatile stocks, has outperformed the S&P 500 each year in that timeframe. This portfolio offered superior returns with reduced risk, enjoying a smoother performance amid market shifts. Given the current unpredictable macroeconomic landscape, with uncertainties around rate cuts and ongoing conflicts, will TMUS repeat its underperformance like it did in 2021 and 2023 over the next 12 months, or is a significant growth spurt on the horizon?
Historically known for its customer-centric policies and competitive pricing, T-Mobile has evolved into one of the premier networks with robust 5G coverage. This expanded capacity allows for faster growth when compared to rivals AT&T and Verizon, with the potential for enhanced profit margins as the Sprint network closes. Meanwhile, free cash flow projections range between $16.6 billion and $17.0 billion. However, T-Mobile’s current price-to-earnings valuation seems elevated versus industry peers. The stock is trading at about 24 times forward earnings, significantly higher than AT&T and Verizon, which trade at values in the high single digits. We estimate TMUS stock to be valued at $184 per share, approximately 10% below its current market price. For a more comprehensive understanding, refer to our analysis on T-Mobile Valuation: Expensive or Cheap to see what’s influencing our price projections. Also, explore our examination of T-Mobile Revenue to understand the company’s key business segments and anticipated revenue trends.
| Returns | Oct 2024 MTD [1] |
2024 YTD [1] |
2017-24 Total [2] |
| TMUS Return | 4% | 35% | 281% |
| S&P 500 Return | 0% | 21% | 158% |
| Trefis Reinforced Value Portfolio | 2% | 17% | 785% |
[1] Returns as of 10/13/2024
[2] Cumulative total returns since the end of 2016
Invest with Trefis Market-Beating Portfolios
See all Trefis Price Estimates
The views and opinions expressed herein are the views and opinions of the author and do not necessarily reflect those of Nasdaq, Inc.
5 Stocks Our Experts Predict Could Double In the Next Year
By submitting your email, you'll also get a free pivot & flow membership. A free daily market overview. You can unsubscribe at any time.