National Grid Shares Dip Below Key Moving Average
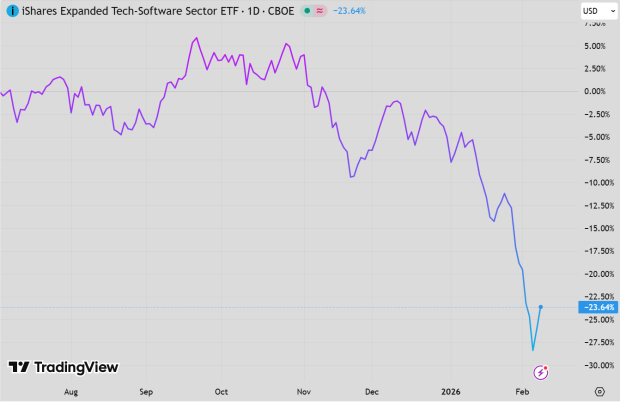
On Friday, shares of National Grid plc (Symbol: NGG) fell below their 200-day moving average of $65.40, trading as low as $65.22 per share. Currently, NGG’s stock is down about 1.6% for the day. The chart below provides a visual of NGG’s performance over the past year compared to its 200-day moving average:

The 52-week range for NGG shows a low of $53.8343 and a high of $71.4299. Recent trading has seen the stock at $65.30.
![]()
![]() Click here to discover which 9 other energy stocks recently dropped below their 200-day moving average »
Click here to discover which 9 other energy stocks recently dropped below their 200-day moving average »
Additional Resources:
- HLF Average Annual Return
- CMS Videos
- NYLD Split History
The views and opinions expressed herein are the views and opinions of the author and do not necessarily reflect those of Nasdaq, Inc.