Midday Market Review: Utilities and Energy Sectors Lag Behind
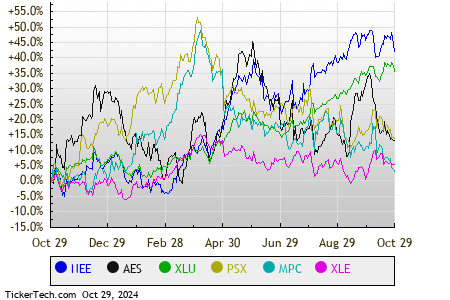
As of midday Tuesday, the Utilities sector is showing the most significant losses in the market, dropping by 1.6%. This slide includes notable companies such as NextEra Energy Inc (Symbol: NEE) and AES Corp (Symbol: AES), which are down by 3.5% and 3.0%, respectively. The Utilities Select Sector SPDR ETF (Symbol: XLU), a fund that tracks utilities stocks, is down 1.9% today but shows an impressive 28.07% gain year-to-date. Specifically, NextEra Energy Inc has risen 34.19% since the start of the year, while AES Corp has seen a decline of 11.38%. Together, these two companies represent approximately 14.2% of XLU’s holdings.
The Energy sector follows closely, posting a 1.3% decrease. Within this sector, Phillips 66 (Symbol: PSX) and Marathon Petroleum Corp. (Symbol: MPC) are underperforming, recording losses of 4.2% and 3.4%, respectively. The Energy Select Sector SPDR ETF (XLE), which tracks energy stocks, is down 1.4% during midday trading and has a year-to-date increase of 7.47%. Performance-wise, Phillips 66 is down 4.74% year-to-date, while Marathon Petroleum Corp. is nearly flat, with a loss of just 0.01%. Combined, these companies account for about 7.6% of XLE’s underlying holdings.
To illustrate the stock price performance over the last twelve months, a relative price chart is provided below. Each stock symbol appears in a distinct color for clarity.

This afternoon, a broader look at the S&P 500 shows varying performance among sectors. Three sectors report gains, while six are experiencing losses.
| Sector | % Change |
|---|---|
| Technology & Communications | +1.2% |
| Industrial | +0.2% |
| Healthcare | +0.1% |
| Services | -0.2% |
| Financial | -0.3% |
| Consumer Products | -0.7% |
| Materials | -0.9% |
| Energy | -1.3% |
| Utilities | -1.6% |
![]()
![]() 25 Dividend Giants Widely Held By ETFs »
25 Dividend Giants Widely Held By ETFs »
Also see:
· Jim Simons Stock Picks
· HMB Historical Stock Prices
· Top Ten Hedge Funds Holding BACR
The views expressed in this article are those of the author and do not necessarily reflect the opinions of Nasdaq, Inc.