DFIC ETF Struggles Below Key Average
DFIC shares dip below 200-day moving average, marking a shift in trading dynamics.
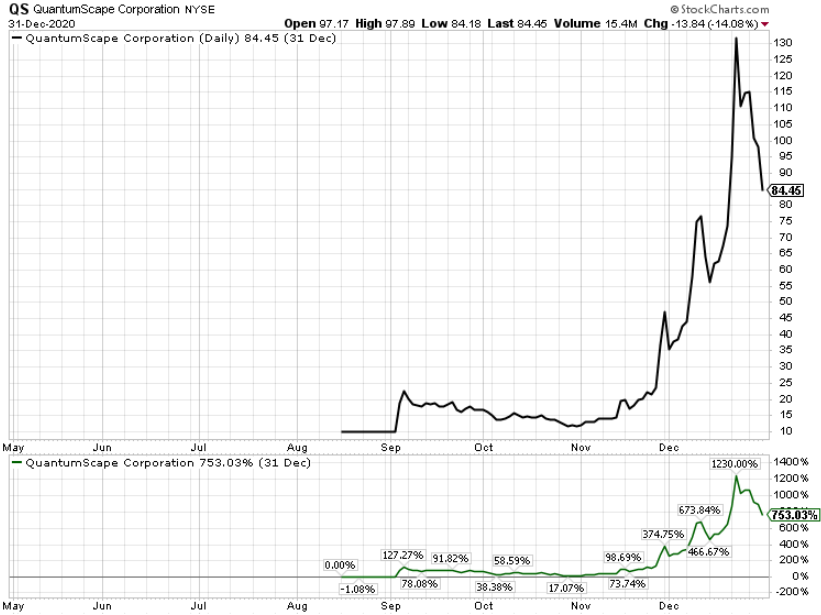
In trading on Thursday, shares of the DFIC ETF (Symbol: DFIC) fell below their 200-day moving average of $26.65, reaching a low of $26.61 per share. Currently, DFIC shares are down approximately 0.9% for the day. The chart below illustrates the one-year performance of DFIC shares compared to its 200-day moving average:

As shown in the chart, DFIC’s lowest point over the last 52 weeks was $22.515 per share, while its 52-week high reached $28.4201. The most recent trade was at $26.59.
![]()
![]() Click here to find out which 9 other ETFs recently crossed below their 200-day moving average »
Click here to find out which 9 other ETFs recently crossed below their 200-day moving average »
Additional Insights:
• Bill Ackman Stock Picks
• TRON Market Cap History
• COP Split History
The views and opinions expressed herein are the views and opinions of the author and do not necessarily reflect those of Nasdaq, Inc.