Survey Reveals American Household Finances: Key Income and Net Worth Statistics
The Federal Reserve conducts its Survey of Consumer Finances (SCF) every three years. This report gathers details regarding income, assets, debt, and demographic characteristics of American households, providing consistent financial snapshots over time.
The latest SCF was completed in 2022 and published in October 2023. The report indicated that the median before-tax income was $70,260, while the median net worth stood at $192,700. With these figures, individuals earning more than these amounts are considered to rank among the top 50% of Americans.
Although these national statistics offer a useful overview, it’s important to note that age plays a significant role in income and wealth accumulation. For a more accurate assessment, individuals should compare their financial standings with those of their age group. Below, we explore the median income and net worth for various age brackets.

Image source: Getty Images.
Median Before-Tax Income by Age Group
The following chart presents a breakdown of median before-tax income among American households, categorized by the age of the reference person.
|
Age Group |
Median Income |
|---|---|
|
18-35 |
$60,530 |
|
35-44 |
$86,470 |
|
45-54 |
$91,880 |
|
55-64 |
$82,150 |
|
65-74 |
$60,530 |
|
75+ |
$49,070 |
|
All Households |
$70,260 |
Data source: Federal Reserve 2022 Survey of Consumer Finances. Note: The reference person is defined as the male in mixed-sex couples and the older individual in same-sex couples.
The figures above represent the 50th percentile, indicating that half of individuals within these age groups earned more and half earned less. For example, those aged 18 to 34 need to earn above $60,530 to be in the upper half of their age cohort. Furthermore, an income greater than $70,260 means being in the top 50% of all American households.
Median Net Worth by Age Group
Net worth is calculated as assets minus debt. The SCF divides assets into two main categories: (1) financial assets such as bank accounts and retirement accounts, and (2) nonfinancial assets including vehicles, real estate, and business equity. Debt encompasses credit card balances, mortgages, student loans, and others.
The chart below shows a detailed breakdown of the median net worth among American households, categorized by the reference person’s age.
|
Age Group |
Median Net Worth |
|---|---|
|
18-34 |
$39,040 |
|
35-44 |
$135,100 |
|
45-54 |
$246,700 |
|
55-64 |
$364,270 |
|
65-74 |
$410,000 |
|
75+ |
$334,700 |
|
All Households |
$192,700 |
Data source: Federal Reserve 2022 Survey of Consumer Finances. Note: The reference person is defined as the male in mixed-sex couples and the older individual in same-sex couples.
The data illustrates the 50th percentile of net worth across age groups, revealing that to rank among the upper half, adults aged 18 to 34 need a net worth above $39,040. Additionally, having a net worth exceeding $192,700 places one in the top 50% of all American households.
While comparisons may be discouraging, it is essential to recognize that anyone can enhance their financial situation through effective budgeting and wise investments.
Budgeting: The First Step Towards Growing Your Net Worth
Financial experts suggest the 50-30-20 budgeting rule, which divides after-tax income into three categories:
- Needs: Allocate 50% of income to essential expenses such as housing, utilities, groceries, transportation, and healthcare, including minimum debt payments.
- Wants: Dedicate 30% of income to non-essential expenditures like entertainment, dining out, and travel.
- Savings: Reserve 20% of income for savings options like high-yield savings accounts, retirement funds, or brokerage accounts, in addition to extra debt payments.
Advisors often urge individuals with high-interest debt, like credit cards, to clear these balances before focusing on savings. Given that high interest can quickly escalate debt, this approach is practical.
Once high-interest debt is managed, it is beneficial to choose various savings vehicles. For example, one might split funds between a high-yield savings account and a brokerage account. Investing in stocks can also be valuable, though the amount should reflect individual risk tolerance.
Historically, the U.S. stock market has been one of the most effective methods for wealth accumulation. An index fund that tracks the S&P 500 (SNPINDEX: ^GSPC) offers a straightforward way to gain exposure to this market.
Why Investing in an S&P 500 Index Fund Makes Sense
The S&P 500 measures the performance of 500 large U.S. companies spanning various sectors, covering approximately 80% of domestic stocks and 50% of global equities by market capitalization. This means an S&P 500 index fund provides a stake in some of the world’s leading companies, such as Apple, Microsoft, and Nvidia.
Investors find three primary reasons to consider an S&P 500 index fund:
- The S&P 500 has outperformed nearly all other investment categories over the past decade, including international stocks and real estate.
- Fewer than 10% of large-cap funds beat the S&P 500 over the last ten years, indicating that most fund managers fall short of the index’s performance.
- Over the last two decades, the S&P 500 achieved a 650% return, averaging 10.6% yearly. For instance, investing $400 monthly could yield over $300,000 after 20 years.
Ultimately, history suggests that patient S&P 500 investors are likely to outperform most asset classes and professional money managers. Furthermore, consistent small investments can lead to substantial portfolios over time. The critical factors are patience and regular investment.
Is Now the Right Time to Invest $1,000 in an S&P 500 Index Fund?
Before investing in an S&P 500 index fund, consider this:
The Motley Fool Stock Advisor analyst team has identified what they regard as the 10 best stocks to buy now, and the S&P 500 Index is not on that list. These stocks hold the potential for significant growth in the coming years.
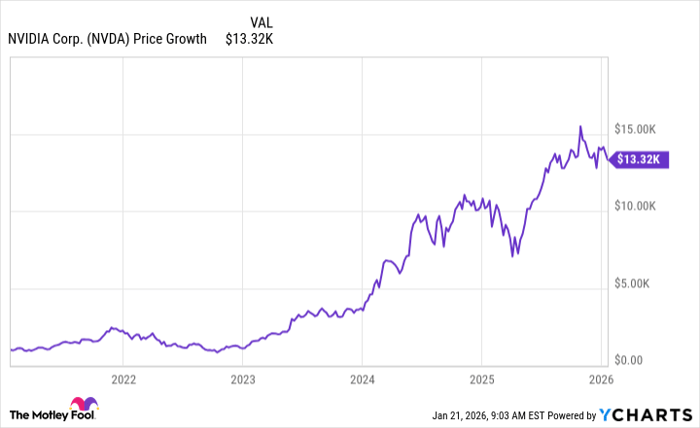
For example, if you had invested $1,000 in Nvidia when it made the list on April 15, 2005, you’d now have $829,746.*
Stock Advisor offers investors a straightforward strategy for success, including portfolio building guidance, analyst updates, and two fresh stock recommendations each month. Since 2002, the Stock Advisor service has significantly outperformed the S&P 500.
See the 10 stocks »
*Stock Advisor returns as of November 4, 2024
Trevor Jennewine has positions in Nvidia. The Motley Fool has positions in and recommends Apple, Microsoft, and Nvidia. The Motley Fool also recommends long January 2026 $395 calls on Microsoft and short January 2026 $405 calls on Microsoft. The Motley Fool has a disclosure policy.
The views expressed here are those of the author and do not necessarily reflect the opinions of Nasdaq, Inc.


