TDTT ETF Shares Dip Below Key Moving Average
Latest Trading Activity and Performance Insights
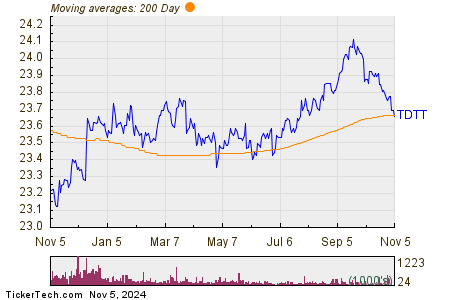
On Tuesday, shares of the TDTT ETF (Symbol: TDTT) fell below their 200-day moving average, which stands at $23.67, hitting a low of $23.66 per share. Currently, TDTT shares are down approximately 0.1% for the day. The chart below illustrates the one-year performance of TDTT shares alongside their 200-day moving average:

From the chart, we see that TDTT’s lowest point in its 52-week range is $22.92 per share, while the highest is $24.1281. The most recent trade price is $23.66.
![]()
Click here to find out which 9 other ETFs recently crossed below their 200-day moving average »
Explore More:
- Low Priced Dividend Stocks
- SVT Historical Stock Prices
- Top Ten Hedge Funds Holding SCAC
The views and opinions expressed herein are the views and opinions of the author and do not necessarily reflect those of Nasdaq, Inc.


