Universal Display Corp (OLED): Boosting Returns with Covered Calls
Unlocking Additional Income from Your Investment
Shareholders of Universal Display Corp (Symbol: OLED) have an opportunity to increase their income beyond the stock’s current annualized dividend yield of 0.9%. One strategy is to sell the May 2025 covered call at a $200 strike price. This move allows investors to collect a premium based on a $16.70 bid, which equates to an additional annualized return of 17.1% against the current stock price. If the stock price remains below $200 and is not called away, the total return could reach approximately 18% annually. In the event that the stock does exceed that threshold, resulting in a call, shareholders would have still gained a 15.8% return, accounting for any dividends received prior to the call.
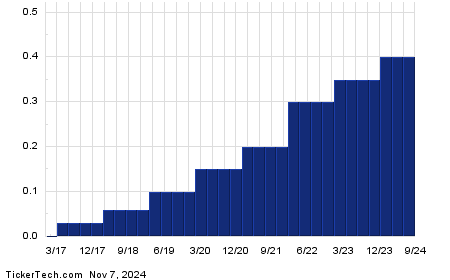
It’s important to note that dividend payouts can be unpredictable, often fluctuating with each company’s profitability. Reviewing the dividend history of Universal Display Corp can provide insights into the stability and future consistency of the 0.9% annualized yield.

Below is a detailed chart illustrating the trading history of OLED over the past twelve months, with the $200 strike indicated in red:

The chart and the stock’s historical volatility serve as helpful tools when considering selling the May 2025 covered call. Calculating the trailing twelve-month volatility for Universal Display Corp (using the last 251 trading day’s closing values along with the current price of $187.06), we find it to be 42%. For additional call option strategies at various expirations, visit the OLED Stock Options page on StockOptionsChannel.com.
On Thursday afternoon, trading data showed the put volume among S&P 500 components at 1.03 million contracts, compared to call volume at 2.05 million, resulting in a put:call ratio of 0.51 for the day. This is significantly lower than the long-term median ratio of 0.65, indicating strong buyer interest in call options at this time.
![]() Explore Top YieldBoost Calls of the S&P 500 »
Explore Top YieldBoost Calls of the S&P 500 »
Also see:
- Institutional Holders of ITM
- PROK Options Chain
- SMID Market Cap History
The views and opinions expressed herein are the views and opinions of the author and do not necessarily reflect those of Nasdaq, Inc.


