Tesla Stock Soars: Understanding Its Valuation and Future Prospects
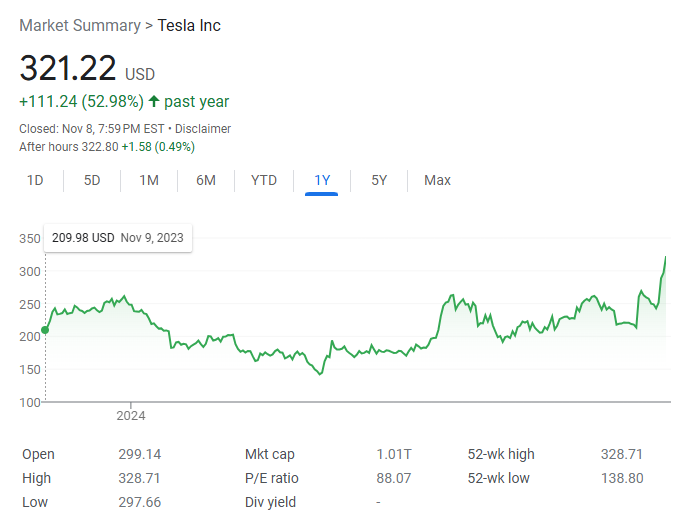
Tesla stock ($TSLA) has surged significantly since the 2024 election results came in. After closing at just over $251 on Tuesday, November 5, the stock climbed 27.8% by the week’s end, reaching over $321. This marks Tesla crossing a $1 trillion market cap for the first time since April 2022. Such a rapid increase raises important questions: What is Tesla’s fair valuation? Is it too late to invest? Should current holders consider selling?
Short-term stock market fluctuations affect individual stocks, influenced by various factors unique to each business. Investors often employ a range of techniques to better understand a stock’s price relative to its financial performance and industry benchmarks.
Below, we’ll explore Tesla’s current data using some of these valuation methods. While these metrics aren’t perfect, they can offer valuable insights into how Tesla compares to its financials and peers in the industry. For personalized advice tailored to your financial goals, consider connecting with a fiduciary financial advisor using this free tool.
Analyzing Tesla’s PE Ratio
Tesla’s PE ratio as of November 8: 87.77
The PE ratio is a straightforward indicator for assessing a company’s stock price in comparison to its earnings. “PE” refers to “Price-to-earnings,” which measures the current stock price against its earnings per share.

To gauge if a stock is over- or undervalued, it’s common to compare its PE ratio with the industry average. For Tesla, categorized under “Consumer Cyclical,” the average PE ratio is 25.87, indicating that Tesla’s ratio is significantly higher. This suggests that investors are anticipating robust short- to medium-term growth.
Some analysts, including Tesla CEO Elon Musk, advocate that Tesla should be viewed as a technology company, where higher PE ratios are typical. For instance, many technology firms have PE ratios that can soar as high as 149, with the industry average at 37.15 according to World PE Ratio.

Evaluating Expected Earnings Growth
Tesla’s estimated 12-month Forward PE: 96.15
Tesla’s estimated 5-year PEG ratio: 9.16
When considering potential growth, the Forward PE ratio provides insights based on projected earnings for the next 12 months. Current estimates from Yahoo Finance show Tesla’s Forward PE at 96.15, subject to variation based on analysts’ future earnings predictions. This ratio is typically compared against companies sharing similar growth characteristics.
The PEG ratio, which divides the PE ratio by expected earnings growth, also offers insight. Yahoo Finance lists Tesla’s PEG ratio at 9.16 over five years. Similar to the Forward PE, variations depend on anticipated earnings and timelines. Investors usually match Tesla’s PEG ratio against comparable companies, which requires careful analysis due to differing growth rate expectations.
Consulting a financial advisor can aid in interpreting earnings guidance and make informed decisions regarding entry or exit points for Tesla and other investments.
Additional Insights: Trading Volume and Volatility
Depending on the stock’s characteristics and your financial goals, various metrics can provide further analysis.
Trading Volume
Tesla’s 65-day average: 82.25 million
Tesla’s November 8 trading volume: 204.78 million
Daily trading volume data, which shows the number of shares traded, indicates demand and investor sentiment. A higher volume reflects stronger demand. During pre-market and after-hours trading, lower volume typically leads to higher price volatility compared to regular market hours when more activity occurs.
It’s crucial to compare trading volume with a stock’s average to gauge interest and risk more effectively.
Assessing Tesla’s Current Market Valuation: Key Metrics and Insights
Investors are taking a closer look at Tesla’s recent stock performance, including trading volume and volatility statistics. Understanding these factors can help gauge the company’s position in the market and its potential for future growth.
Understanding Trading Volume
Tesla’s recent trading activity shows a notable spike in demand. According to Barron’s, the 65-day trading average is currently at 82.25 million shares. However, on Friday, November 8, trading volume surged to 204.78 million shares—about 2.5 times the average, indicating high investor interest.
Measuring Volatility: Beta Explained
Tesla’s beta: 2.33
Beta measures how much a stock’s price tends to fluctuate compared to the market. A beta of 1 means the stock typically moves in line with market changes. Conversely, a beta above 1 suggests greater volatility. Tesla’s beta is reported at 2.33, meaning that if the S&P 500 rises or falls by 1% in a day, Tesla could move as much as 2.33% in either direction due to market volatility alone. Other factors may influence this range as well.
For investors, understanding this high beta is essential. It may attract those looking for aggressive growth opportunities, although conservative investors may find this volatility daunting, especially during market downturns.
Evaluating Other Metrics
In addition to trading volume and beta, several metrics can help investors evaluate Tesla:
- Price-to-Sales (PS) Ratio: This ratio helps investors understand how much they are paying for each dollar of Tesla’s revenue.
- Price-to-Free-Cash-Flow (P/FCF) Ratio: This indicates how a company’s stock price compares to the cash it generates after expenses. This is particularly relevant for Tesla due to its significant reinvestments.
- Discounted Earnings Model: This model estimates future earnings, providing insights into long-term growth prospects.
- Technical Analysis: This approach focuses on price movement patterns and trading volume, independent of financial fundamentals.
Each of these metrics offers a different perspective on Tesla’s investment potential, catering to various investor strategies. Consulting with a financial advisor can help in interpreting these metrics effectively.
Limitations of Analysis Methods
While fundamental and technical analysis can provide valuable insights, they have limitations. These methods often rely on historical data, which might not reflect rapid changes in market dynamics, technology, or management strategies. For instance, Tesla’s innovations in electric vehicles may not be fully captured by traditional metrics.
Market sentiment, news, and macroeconomic trends can also create discrepancies between a stock’s perceived and actual value. Factors like political changes can impact Tesla’s supply chains and overall performance.
Your personal risk tolerance and investment objectives are crucial elements to consider. A high price-to-earnings (PE) ratio may indicate growth potential for some investors, while others may view it with caution. Stocks like Tesla can have sudden price swings, which may not suit every investor.
Thus, supplementing these analyses with broader market knowledge will lead to a more informed investment decision. It may also be helpful to collaborate with a fiduciary financial advisor for tailored insights regarding Tesla or other potential investments.
Helpful Tips and Resources
- Stay informed about market changes by signing up for the Market Minute newsletter, featuring updates on stocks like Tesla.
- Establish an emergency fund for unexpected expenses. Ensure the account is secure, although note that inflation may erode some value over time.
- Financial advisors can benefit from connecting with leads through SmartAsset AMP, which offers marketing solutions for growing their business.
Photo credit: Grok, Google.
This is not an offer to buy or sell any security or interest. All investing involves risk, including loss of principal. This article is for informational purposes only and is not intended to provide legal, tax, accounting, or financial advice. Before making any final decisions, you should seek advice from your financial advisor or other specialists aware of your circumstances. SmartAsset connects users with fiduciary financial advisors but does not manage client funds or hold assets.
The post What’s a Fair Valuation for Tesla ($TSLA) Today? appeared first on SmartReads by SmartAsset.
The views expressed here are those of the author and do not necessarily reflect those of Nasdaq, Inc.


