Corteva Inc. Shares Slip Below 200-Day Moving Average
Stock Performance and Key Metrics at a Glance
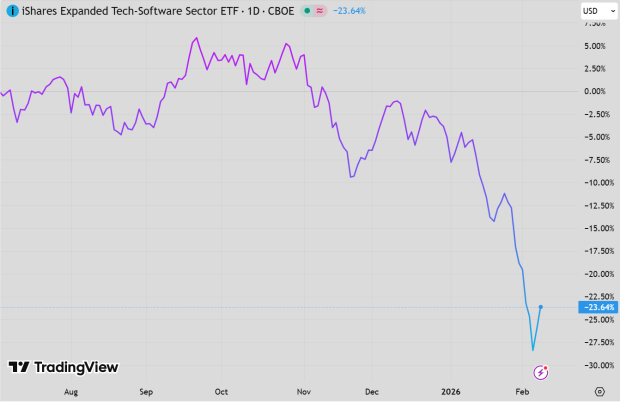
During trading on Friday, Corteva Inc (Symbol: CTVA) saw its shares drop below the 200-day moving average of $55.47. At one point, shares were trading as low as $55.19. Currently, the stock is down approximately 3.8% for the day. The accompanying chart illustrates CTVA’s performance over the past year compared to its 200-day moving average:

The chart reveals that CTVA’s lowest point in the last 52 weeks was $43.89 per share, while its highest reached $63.75. Today’s last trade price stands at $55.21. The data regarding CTVA’s moving average was sourced from TechnicalAnalysisChannel.com.
![]()
![]()
Click here to discover which 9 other dividend stocks recently fell below their 200-day moving average »
Also see:
• CEF Channel
• COTY Insider Buying
• DADA Stock Predictions
The views and opinions expressed herein are those of the author and do not necessarily reflect those of Nasdaq, Inc.