Exploring Options Trading: Understanding the Schaeffer’s Volatility Scorecard
Options vs. Stocks: A New Set of Rules
Buying options is fundamentally different from purchasing stocks. While a stock buyer needs to predict the direction of a stock’s price, an options buyer also has to consider time. An option must not only move in the right direction but do so significantly within a specified timeframe. This urgency exists because of time decay, which diminishes the option’s value as its expiration date approaches.
The Role of Implied Volatility in Options Pricing
Implied volatility (IV) is crucial for determining time value. It reflects market predictions about how much the stock price will fluctuate throughout the option’s life. Here at Schaeffer’s, we utilize a tool known as the Schaeffer’s Volatility Scorecard (SVS) to identify stocks that often see greater price variations than the IV of their options would indicate.
How the Schaeffer’s Volatility Scorecard Works
The SVS evaluates stocks’ historical volatility against the expected volatility embedded in their at-the-money options over the previous year. This analysis allows us to find which stocks have been the most and least effective for option premium buyers.
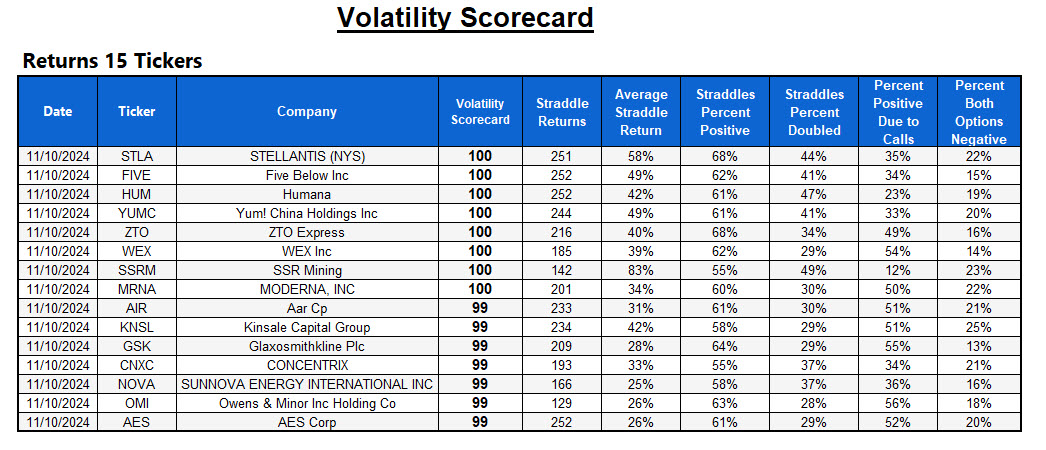
Calculating the SVS involves assessing straddle returns across 252 trading days of the past year. Straddle prices are determined daily using hypothetical at-the-money options that expire in one week or one month. We base option valuations on the implied volatilities from actual options that closely match these hypothetical parameters. The performance of these hypothetical straddles is compared among all stocks, resulting in a score ranging from 0 to 100. Below, you’ll find the top 20 stocks that achieved scores of 99 or 100.

Understanding the SVS Value and Its Implications
It’s important to note that some stocks may lack complete return data due to limited trading or wide bid/ask spreads. The SVS score derives from about 250 hypothetical straddle returns per stock each year and incorporates three weighted criteria: 40% based on the average straddle return, 40% on the percentage of positive returns, and 20% on the ranking percentage of straddle IVs. These combined figures create a score between zero and 100.
Higher SVS scores, close to 100, indicate stocks that typically offer larger returns than the IV suggests, suggesting they may be strong candidates for option-buying strategies. Conversely, a low SVS score, which can drop to zero, signals stocks that often have lower volatility than predicted, hinting they might be good for premium-selling strategies.
Using the SVS Effectively in Your Trading
It is essential to remember that the SVS is a lagging indicator and doesn’t guarantee future results. To enhance effectiveness, we analyze the SVS in conjunction with real-time volatility indicators, such as 30-day at-the-money IVs and broader term structures, along with traditional technical and sentiment analysis. This comprehensive approach helps us pinpoint the most promising stocks for potential option-buying opportunities.
Want to dive deeper into options trading? Check out this handy guide to implied volatility. And prepare for earnings season by reviewing effective options strategies.
The views and opinions expressed herein are the views and opinions of the author and do not necessarily reflect those of Nasdaq, Inc.


