Maximizing Income: Bloomin’ Brands Inc Offers Solid Opportunities
Covered Call Strategy Set to Boost Income
Shareholders of Bloomin’ Brands Inc (Symbol: BLMN) seeking to enhance their income beyond a 7.4% annualized dividend yield can consider selling an April 2025 covered call at the $15 strike price. By doing so, investors could collect a premium based on the current bid of 70 cents, leading to an annualized return of approximately 13.2% in addition to the existing dividend yield. This strategy could yield a total return of 20.6% annually, assuming the stock isn’t called away. Notably, if BLMN shares appreciate to over $15, the shareholder would forfeit the any further upside; however, that would only occur if the stock climbs 15.9% from its current levels. In the event that the stock is called, shareholders could still realize a return of 21.3% from this trading level, plus any dividends accrued beforehand.
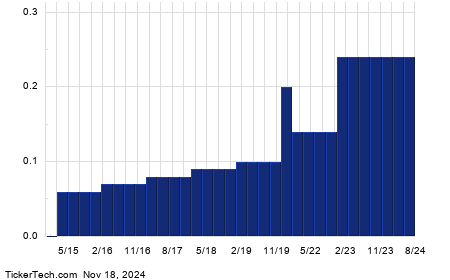
Dividend payouts are often influenced by a company’s profitability, making them unpredictable. For Bloomin’ Brands Inc, reviewing the dividend history chart below can aid investors in assessing the likelihood of sustaining the recent dividend and whether the 7.4% yield remains feasible.

Understanding Stock Movements and Historical Trends
The chart below illustrates BLMN’s trailing twelve-month trading history, with the important $15 strike price marked in red:

Utilizing the stock’s historical volatility alongside fundamental analysis may help investors determine if selling the April 2025 covered call at the $15 strike price offers a reasonable reward in relation to the risks involved. For context, the trailing twelve-month volatility for Bloomin’ Brands Inc, calculated using the most recent 250 trading days, currently stands at 41%. To explore alternative call options across various expiration dates, visit the BLMN Stock Options page at StockOptionsChannel.com.
During mid-afternoon trading on Monday, the put volume among S&P 500 components reached 1.24 million contracts, while call volume stood at 2.15 million. This resulted in a put-to-call ratio of 0.57 for the day, indicating a preference for calls among traders relative to puts, considering the long-term median put-to-call ratio is 0.65.
Additionally, discover which 15 call and put options traders are discussing today.
![]() Top YieldBoost Calls of the S&P 500 »
Top YieldBoost Calls of the S&P 500 »
Also see:
- BDC Investor
- Top Ten Hedge Funds Holding DUKE
- HYDD market cap history
The views and opinions expressed herein are those of the author and do not necessarily reflect the opinions of Nasdaq, Inc.


