SoFi, AECOM, and Hubbell: A Closer Look at Active Options Trading
SoFi Technologies Options Surge
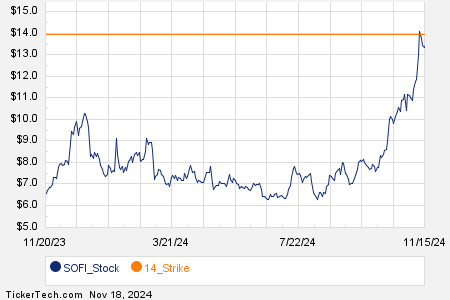
In today’s options trading for the Russell 3000 index, SoFi Technologies Inc (Symbol: SOFI) is seeing significant activity. So far, a total of 278,208 contracts has been traded, equivalent to around 27.8 million shares since each contract represents 100 shares. This volume accounts for 42.8% of SoFi’s average daily trading volume of 65.0 million shares over the past month. Notably, the $14 strike call option expiring November 22, 2024, has experienced the highest volume with 17,563 contracts traded today, translating to about 1.8 million underlying shares. Below is a chart detailing SOFI’s trading history over the last twelve months, highlighting the $14 strike in orange:

A Look at AECOM’s Options Trends
AECOM (Symbol: ACM) has also caught traders’ attention, with 3,355 contracts traded today. This figure reflects approximately 335,500 underlying shares, representing 42.5% of ACM’s average daily trading volume of 788,990 shares over the last month. The $95 strike put option expiring December 20, 2024, has seen a particularly high volume of 2,084 contracts, accounting for around 208,400 shares. Below is a chart showing ACM’s trading history, with the $95 strike option highlighted in orange:

Hubbell Inc.’s Trading Activity
Hubbell Inc. (Symbol: HUBB) is not far behind, with options trading volume at 1,803 contracts. This corresponds to approximately 180,300 underlying shares, or 41.3% of HUBB’s average daily trading volume of 436,955 shares over the previous month. A standout option is the $450 strike call expiring December 20, 2024, which has recorded 701 contracts traded so far, representing around 70,100 underlying shares. The chart below illustrates HUBB’s trading history over the past year, with the $450 strike marked in orange:

For details on the different expiring options available for SOFI, ACM, and HUBB, you can visit StockOptionsChannel.com.
![]() Today’s Most Active Call & Put Options of the S&P 500 »
Today’s Most Active Call & Put Options of the S&P 500 »
Also see:
- IMOM market cap history
- Institutional Holders of KST
- SPLB market cap history
The views and opinions expressed herein are the views and opinions of the author and do not necessarily reflect those of Nasdaq, Inc.


