Major Inflows Boost DFUS ETF Performance This Week
Notable $214 Million Increase in Outstanding Units
Recent data from ETF Channel highlights a significant change in the DFUS ETF (Symbol: DFUS), which saw an inflow of approximately $214.0 million. This translates to a 1.8% increase in the number of outstanding units, rising from 185,000,000 to 188,300,000 week-over-week.
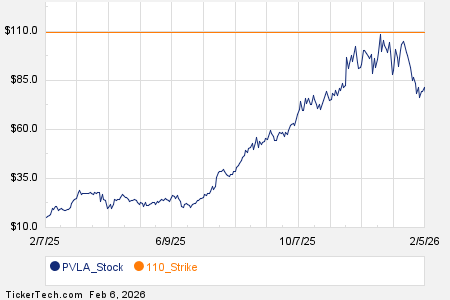
The chart below illustrates DFUS’s one-year price performance compared to its 200-day moving average:

According to the chart above, DFUS’s lowest price over the past 52 weeks was $49.17 per share, while the highest reached $65.52. Currently, the last recorded trade was at $64.93. Evaluating the recent share price against the 200-day moving average can serve as an effective tool for technical analysis.
Exchange-traded funds (ETFs) operate similarly to stocks, but investors trade “units” instead of “shares.” These units can be bought or sold like stocks, but they can also be created or redeemed based on investor demand. Monitoring changes in outstanding shares weekly allows us to pinpoint ETFs that experience significant inflows or outflows. When new units are created, the ETF must purchase the underlying holdings, while a decrease in units requires selling those holdings. Consequently, large inflows or outflows impact the assets held within the ETFs.
![]()
![]() Click here to find out which 9 other ETFs had notable inflows »
Click here to find out which 9 other ETFs had notable inflows »
Additionally:
- AIMT Split History
- Institutional Holders of WWII
- VINP Videos
The views and opinions expressed herein are those of the author and do not necessarily reflect the views of Nasdaq, Inc.