Interest Rate Cuts: A Double-Edged Sword for Investors
The U.S. Federal Reserve focuses on two key goals: maintaining the Consumer Price Index (CPI) to rise at a steady annual rate of 2% and ensuring full employment, although it does not have a specific unemployment rate target. To meet these objectives, the Fed adjusts the federal funds rate, which is the interest rate banks charge each other for overnight loans.
In 2022, as inflation hit a 40-year high of 8%, the Fed launched one of the most intense campaigns in its history to raise interest rates. This action was crucial in curbing inflation.
Fortunately, inflation has moderated considerably since then. This shift allowed the Fed to cut interest rates in September 2023 for the first time since March 2020, with another cut in November, signaling further potential reductions.
Future Rate Cuts on the Horizon
The spike in CPI during 2022 can be attributed to several inflationary factors:
- The U.S. government infused trillions into the economy in 2020 and 2021 to mitigate the fallout from the COVID-19 pandemic.
- The Fed lowered the federal funds rate to a historic low of 0% to 0.25% in 2020 and implemented quantitative easing (QE), injecting more capital into the financial system.
- Global shutdowns during the pandemic resulted in shortages of consumer goods, causing prices to surge.
Beginning in March 2022, the Fed began increasing rates, reaching a range of 5.25% to 5.5% by August 2023. This marked the highest rate in two decades, aimed at cooling an overheated economy.
The strategy proved effective, as CPI fell to 4.1% in 2023 and hit an annualized rate of 2.6% in October 2024, bringing the Fed’s 2% inflation goal within reach.
This accomplishment prompted the Federal Open Market Committee (FOMC) to lower the federal funds rate by 50 basis points in September, followed by another cut of 25 basis points in November. Projections suggest there may be another 25-basis-point reduction in December, with an anticipated 125 basis points total for 2025 and 25 basis points in 2026.
While the FOMC’s forecast is subject to change based on upcoming economic data, the path may lead to a federal funds rate below 3% in the next two years.
S&P 500 Trends After Rate Cuts
Lower interest rates typically benefit the stock market for various reasons. Corporations can borrow funds more easily to expand and benefit from reduced loan servicing costs, which boosts earnings. Additionally, decreased yields on safe assets like cash and U.S. Treasury bonds often redirect investors toward stocks.
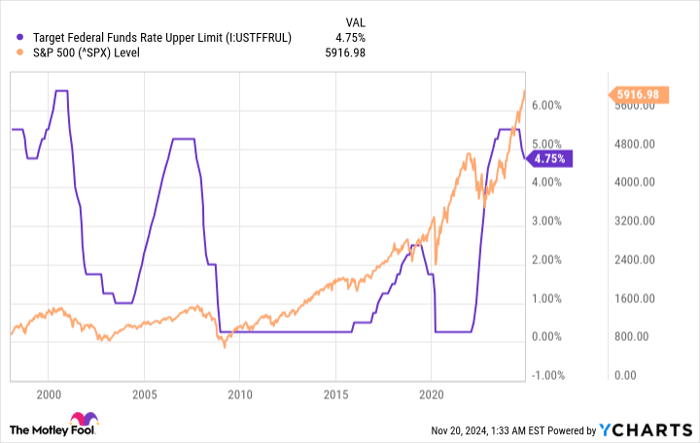
However, historical data since 2000 shows that each rate-cutting cycle by the Fed has often preceded a short-term correction in the stock market. The chart below illustrates this relationship:

Target Federal Funds Rate Upper Limit data by YCharts
Though the S&P 500 tends to rise over time, this correlation is not a prompt for investors to panic. The Fed usually adjusts rates amid economic weakness, which likely contributes to stock market declines, rather than the cuts themselves.
For example, rate cuts occurred after the dot-com burst in the early 2000s, the global financial crisis in 2008, and the pandemic in 2020. Currently, the S&P 500 is trading near record highs, a positive indicator that an economic crisis does not seem imminent.
Recognizing Economic Signals
While the U.S. economy is stable, some signs suggest emerging weaknesses. The unemployment rate has risen to 4.1% from 3.7% at the year’s start. A further decline in the job market may impact consumer spending and hinder economic growth.
Historically, rising interest rates often lead to recessions, as the Fed raises rates to slow economic momentum, which can sometimes overshoot into deeper economic troubles.
The following chart shows the effective federal funds rate since the 1960s, marking recessionary periods in gray:

Effective Federal Funds Rate data by YCharts
Thus, if the S&P 500 faces a decline, it likely results from prior rate hikes impacting the economy rather than the more recent cuts.
Corporate earnings drive stock prices. In challenging economic climates, companies struggle to grow, leading to a likely drop in the S&P 500. Currently, the S&P trades at a historically high valuation, indicating a potential for more significant corrections if a downturn occurs.
Despite these warnings, investors should not rush to sell their stocks. Instead, they ought to prepare for possible market shifts and develop a strategy for buying if prices drop. History indicates the S&P 500 consistently trends upward over the long term.
Evaluating S&P 500 Index Investments
Before investing in the S&P 500 Index, consider this:
The Motley Fool Stock Advisor analyst team has highlighted what they believe are the 10 best stocks to buy right now, and S&P 500 Index isn’t on the list. These selected stocks could lead to significant returns in the coming years.
For example, if you had invested $1,000 in Nvidia after it made this list on April 15, 2005, your investment would have grown to $898,809!*
Stock Advisor provides a straightforward approach to investing, featuring guidance on portfolio building, consistent analyst updates, and two new stock picks monthly. This service has significantly outperformed the S&P 500 since its inception in 2002.*
See the 10 stocks »
*Stock Advisor returns as of November 18, 2024
Anthony Di Pizio has no position in any of the stocks mentioned. The Motley Fool has no position in any of the stocks mentioned. The Motley Fool has a disclosure policy.
The views and opinions expressed herein are the views and opinions of the author and do not necessarily reflect those of Nasdaq, Inc.


