Costco’s Current Valuation: A Historical Perspective on High P/E Ratios
When considering investments, it’s vital to understand the implications of price-to-earnings (P/E) ratios. A $1 million investment in a business yielding $100,000 a year translates to a P/E ratio of 10, indicating the investor would recover their initial investment in a decade, with profits thereafter. However, in reality, earnings fluctuate frequently, complicating this straightforward equation.
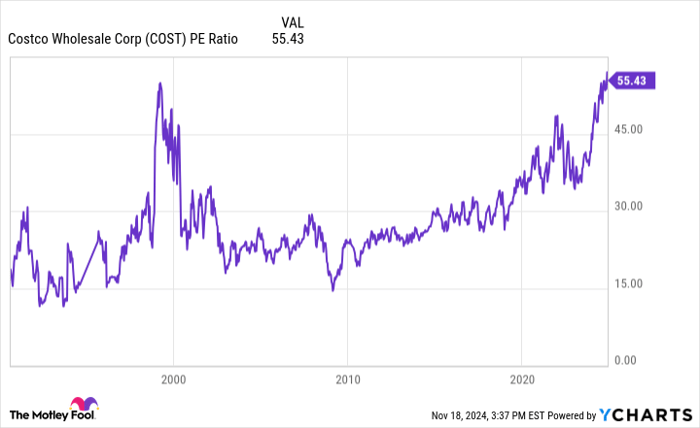
Currently, Costco Wholesale (NASDAQ: COST) is commanding a P/E ratio of 55, marking only the second instance in its history surpassing 50. This situation has sparked intense interest among investors.

COST PE Ratio data by YCharts
The Past as a Guide
Back in early 1999, Costco’s P/E ratio also soared above 50 amid the dot-com boom. The stock reached an all-time high in early 2000 right before the market experienced a significant downturn, resulting in a nearly 50% loss by 2002. Notably, during this period, Costco’s operations remained healthy, with revenue and earnings per share (EPS) both rising.

COST data by YCharts
While the P/E ratio may seem irrelevant during a market crash, it’s important to consider that such high valuations often attract market bubbles, as was the case in 2000.
Currently, the S&P 500 trades at its second-highest P/E valuation since that dot-com era, suggesting a possible bubble again, similar to conditions in the past. Increased valuations often precede sharp declines, which makes Costco’s current standing concerning.
Likely Outcomes Moving Forward
A high P/E ratio is typically justified only if a company is expected to experience significant earnings growth. Given Costco’s size, substantial growth may be less likely. Therefore, a stock price decline in the near future aligns with historical patterns, suggesting that current valuations may indeed be inflated.
Investors who bought Costco at peak valuations were initially disappointed. However, because Costco has a robust business model, it eventually recovered and provided significant long-term gains, totaling over 1,900% since 2000.
For those who opted to invest continuously over time, the outcomes were much better. Below is a table highlighting potential returns for investments made between 2000 and 2003.
| Investment Date | Investment | Percentage Return by 2010 | Value by 2010 |
|---|---|---|---|
| Jan. 1, 2000 | $1,000 | 58% | $1,583 |
| Jan. 1, 2001 | $1,000 | 81% | $1,808 |
| Jan. 1, 2002 | $1,000 | 63% | $1,627 |
| Jan. 1, 2003 | $1,000 | 157% | $2,573 |
| Jan. 1, 2004 | $1,000 | 94% | $1,942 |
| Total | $5,000 | 91% | $9,533 |
Data source: YCharts.
Investors who spread their investments over time reaped significant long-term rewards despite initial declines. As mentioned, Costco stock presently appears overvalued, discouraging large new investments now. However, it remains a strong business worth holding onto.
For those who value Costco’s business fundamentals, a gradual investment approach over several years might reduce the risk of buying into an overvalued stock.
Should You Consider Investing in Costco Now?
Before proceeding with an investment in Costco Wholesale, take note:
The Motley Fool Stock Advisor analyst team recently highlighted what they consider the 10 best stocks to invest in, and Costco did not make the list. These stocks may present greater growth potential in the coming years.
For perspective, if you had invested $1,000 in Nvidia when it was recommended on April 15, 2005, it would now be worth approximately $869,885!
Stock Advisor offers a straightforward investment strategy with ongoing analyst updates and two new stock recommendations every month. Since 2002, the service has notably outperformed the S&P 500, delivering over four times its returns.*
See the 10 stocks »
*Stock Advisor returns as of November 18, 2024
Jon Quast has no position in any of the stocks mentioned. The Motley Fool has positions in and recommends Costco Wholesale. The Motley Fool has a disclosure policy.
The views and opinions expressed herein are those of the author and do not necessarily reflect those of Nasdaq, Inc.


