STAG Industrial Shares Surpass 200-Day Average: A Look at Recent Trends
Market Activity Shows Slight Increase for STAG
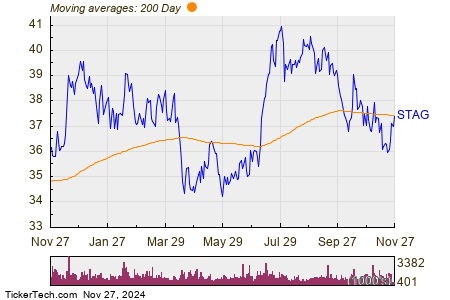
In trading on Wednesday, STAG Industrial Inc (Symbol: STAG) saw its shares rise above their 200-day moving average of $37.46, reaching a peak of $37.69 per share. Currently, STAG shares are up approximately 0.9% for the day. The following chart illustrates the performance of STAG shares over the past year compared to the 200-day moving average:

Examining the chart, STAG’s lowest point in the past 52 weeks was $34.09 per share, while the highest point reached $41.63. The most recent trade price stands at $37.41.
Free Report: Top 8%+ Dividends (paid monthly)
![]()
![]() Click here to discover which other dividend stocks recently crossed above their 200-day moving average »
Click here to discover which other dividend stocks recently crossed above their 200-day moving average »
Related Insights:
- Top Ten Hedge Funds Holding IONM
- CRD.B YTD Return
- Top Ten Hedge Funds Holding DVMT
The views and opinions expressed herein are those of the author and do not necessarily reflect those of Nasdaq, Inc.