MicroStrategy’s Shares Face Potential Decline Amid Bearish Indicators
Current Trading Status
Shares of MicroStrategy Incorporated MSTR are trading slightly higher on Tuesday. Nonetheless, analysts warn that they might breach significant support levels and move downwards.
Chart Patterns Signal Trouble
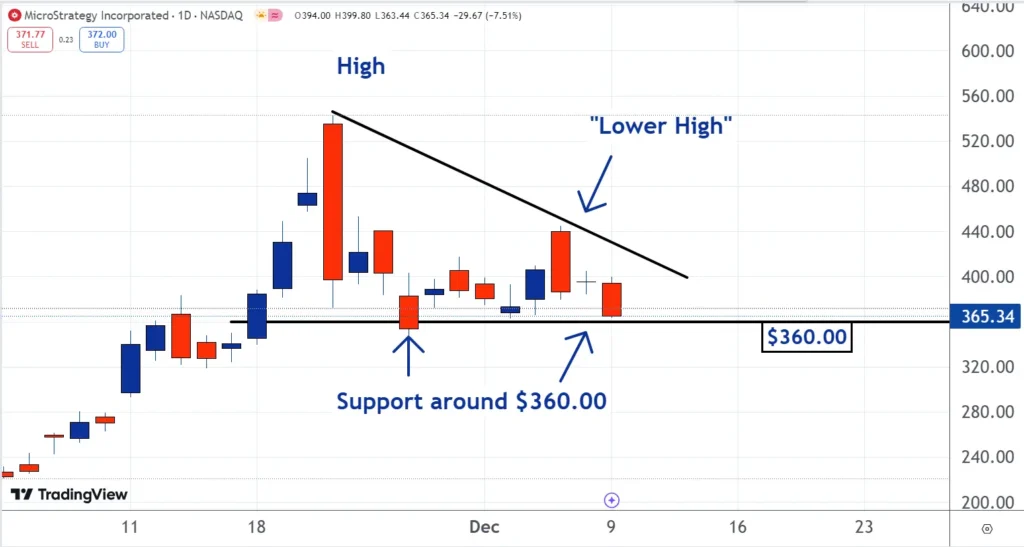
A descending triangle pattern has formed on the stock chart. This bearish formation indicates that the current downtrend could persist, prompting our team of technical analysts to designate it as our “Stock of the Day.”
Understanding Technical Analysis
Grasping technical analysis requires understanding that chart patterns are not mystical signs. Rather, they visually represent price movements shaped by investor behaviors and sentiments.
The Dynamics of the Descending Triangle
The descending triangle illustrates that over time, buyers are showing patience, while sellers are becoming more aggressive. This imbalance—between cautious buyers and eager sellers—creates a likelihood for the stock price to decrease.
Support for MicroStrategy has been hovering around $360.00. Many buyers have been waiting at this level, hoping for sellers to lower their prices.
Investor Considerations
This situation is exhibited through the horizontal support line on the chart.
However, as sellers grew increasingly assertive, they accepted lower prices, which is evident in the descending resistance line on the chart.
Market Trends and Their Implications
Market movements are seldom linear. Trends exhibit peaks and valleys, and when a peak is lower than a preceding one, traders refer to it as a “lower high.” This suggests that sellers were willing to transact at reduced prices.
Psychological Factors at Play
Technical analysis often faces skepticism on Wall Street, which is understandable. Many analysts attempt to identify patterns without thoroughly comprehending the market psychology that leads to their emergence, which can lead to inaccurate predictions.
Viewing technical analysis from a psychological perspective provides clarity. The descending triangle reflects a market where aggressive sellers and passive buyers create bearish conditions.
Consequently, MicroStrategy may likely breach support and see prices decline.
Read Next:
Photo: Shutterstock
Market News and Data brought to you by Benzinga APIs
5 Stocks Our Experts Predict Could Double In the Next Year
By submitting your email, you'll also get a free pivot & flow membership. A free daily market overview. You can unsubscribe at any time.