Record Options Trading Surge for Vornado, Lamb Weston, and Airbnb
We analyze the significant trading volumes affecting these major companies.
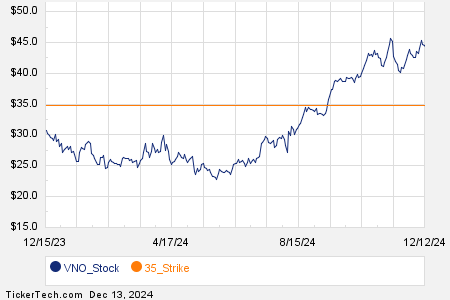
Among the components of the Russell 3000 index, notable options trading was observed today, particularly in Vornado Realty Trust (Symbol: VNO). A remarkable total of 106,727 contracts have been exchanged thus far, equating to approximately 10.7 million underlying shares. This figure represents about 880.7% of VNO’s average daily trading volume over the past month, which was 1.2 million shares. The $35 strike call option expiring on January 17, 2025, led the activity, with 20,400 contracts trading today, corresponding to around 2.0 million underlying shares of VNO. Below is a chart illustrating VNO’s trading history over the past year, with the $35 strike highlighted in orange:

Next, Lamb Weston Holdings Inc (Symbol: LW) also exhibited significant options activity. A total of 21,210 contracts have traded, representing about 2.1 million underlying shares, which accounts for 130% of LW’s average daily trading volume over the past month of 1.6 million shares. The $77.50 strike call option, set to expire on January 17, 2025, was particularly active, with 6,123 contracts traded today, equating to approximately 612,300 underlying shares of LW. Below is a chart showcasing LW’s trading history over the past year, with the $77.50 strike highlighted in orange:

Airbnb Inc (Symbol: ABNB) reported a volume of 52,710 contracts today, translating to about 5.3 million underlying shares. This volume is 115.8% of ABNB’s average daily trading volume over the previous month, which was 4.6 million shares. The $120 strike put option set to expire on January 17, 2025, saw a high volume of 5,237 contracts traded, representing approximately 523,700 underlying shares of ABNB. Below is a chart displaying ABNB’s trading history over the last twelve months, with the $120 strike highlighted in orange:

For additional expirations available for VNO, LW, or ABNB options, please visit StockOptionsChannel.com.
![]() Today’s Most Active Call & Put Options of the S&P 500 »
Today’s Most Active Call & Put Options of the S&P 500 »
Also see:
• Historical PE Ratio
• MFAC market cap history
• THLD Videos
The views and opinions expressed herein are those of the author and do not necessarily reflect those of Nasdaq, Inc.


