Utilities and Consumer Products Struggle Amid Market Fluctuations
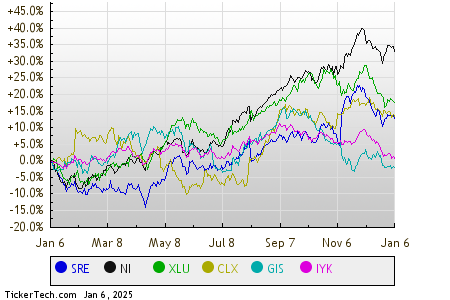
The Utilities sector faced the sharpest downturn in the market on Monday, registering a 0.9% decline. Notably, stocks like Sempra (Symbol: SRE) and NiSource Inc. (Symbol: NI) have experienced significant losses, with drops of 2.7% and 1.9%, respectively. The Utilities Select Sector SPDR ETF (Symbol: XLU), which tracks this sector, also fell, down 0.7% for the day but still up 1.10% year-to-date. Year-to-date performance shows Sempra down 2.74% and NiSource down 2.91%. Together, SRE and NI constitute about 6.1% of XLU’s holdings.
Following closely, the Consumer Products sector reported a minor loss of 0.2%. Within this sector, significant declines were noted for Clorox Co. (Symbol: CLX) and General Mills Inc. (Symbol: GIS), which saw losses of 3.6% and 2.8%, respectively. The iShares U.S. Consumer Goods ETF (IYK), reflecting the performance of consumer products stocks, was down 1.1% in midday trading and has a year-to-date decrease of 1.34%. For context, Clorox is down 3.30% year-to-date, while General Mills is down 2.59%. CLX and GIS make up about 2.6% of IYK’s holdings.
To better understand the performance of these stocks and ETFs, a comparison of their price movements over the past twelve months is illustrated in the chart below. Each symbol is marked in a different color, as indicated in the legend.

In a broader view of the S&P 500 sectors during afternoon trading, five sectors showed positive movement, while three sectors experienced declines.
| Sector | % Change |
|---|---|
| Materials | +1.4% |
| Healthcare | +1.0% |
| Technology & Communications | +1.0% |
| Services | +0.5% |
| Industrial | +0.2% |
| Energy | -0.0% |
| Financial | -0.1% |
| Consumer Products | -0.2% |
| Utilities | -0.9% |
![]()
![]() 10 ETFs With Stocks That Insiders Are Buying »
10 ETFs With Stocks That Insiders Are Buying »
Also see:
Top Stocks Held By Howard Marks
Teledyne Technologies market cap history
ETFs Holding NVS
The views and opinions expressed herein are those of the author and do not necessarily reflect the views of Nasdaq, Inc.