SentinelOne Shares Surpass 200-Day Moving Average
Stock Performance Gains Traction Amid Market Activity
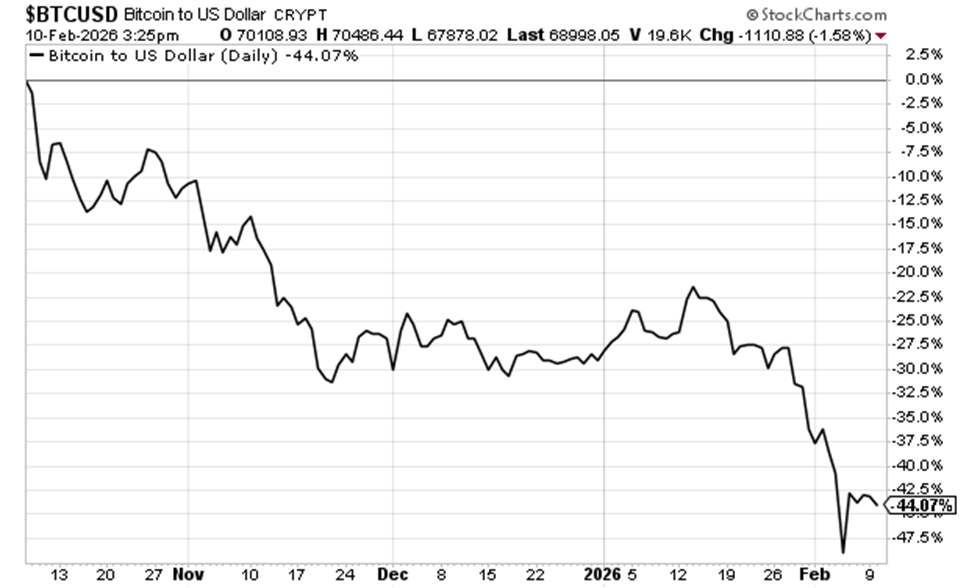
In trading on Wednesday, shares of SentinelOne Inc (Symbol: S) moved above their 200-day moving average of $22.86, reaching a high of $23.28 per share. Currently, SentinelOne shares are trading up about 1.5% for the day. The chart below illustrates S’s performance over the last year compared to its 200-day moving average:

Looking at the chart above, S’s 52-week low is $14.33 per share, while the 52-week high is $30.76, with the latest trade occurring at $22.87.
![]()
![]() Click here to find out which 9 other stocks recently crossed above their 200-day moving average »
Click here to find out which 9 other stocks recently crossed above their 200-day moving average »
Also see:
- Dividend Stock Screener
- SSYS YTD Return
- MCB Videos
The views and opinions expressed herein are those of the author and do not necessarily reflect the views of Nasdaq, Inc.