Franklin Resources Shares Surge Past Key Moving Average
Trading Activity Highlights Strong Gains for BEN Stock
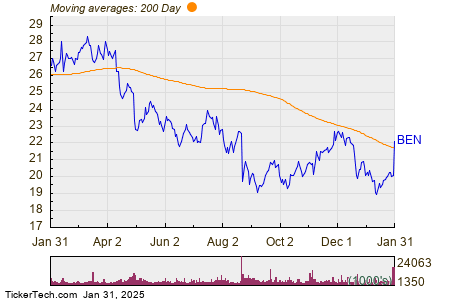
On Friday, shares of Franklin Resources Inc (Symbol: BEN) climbed above their 200-day moving average, which stands at $21.76. The stock reached a high of $22.59 during the trading session, marking an impressive 11% increase for the day. The chart below illustrates the one-year performance of BEN shares compared to its 200-day moving average:

According to the above chart, BEN has a 52-week low of $18.825 per share and a high of $28.61. The most recent trade settled at $22.12. This data on BEN’s moving average was sourced from TechnicalAnalysisChannel.com.
![]()
![]() Discover which 9 other dividend stocks have recently surpassed their 200-day moving average »
Discover which 9 other dividend stocks have recently surpassed their 200-day moving average »
Additional Insights:
- Top Ten Hedge Funds Holding ULS
- Institutional Holders of FCBC
- FPI Dividend History
The views and opinions expressed herein are those of the author and do not necessarily reflect those of Nasdaq, Inc.