“`html
Market Outlook: The NEOS Nasdaq-100 High Income ETF’s Strategy for 2025
Stock Market Summary: A Look at Recent Returns
Over the last two years, the stock market has seen remarkable gains. In 2023, the Nasdaq-100 produced a return of 54.8%, followed by a 25.5% return in 2024. This significantly outpaces the Nasdaq-100’s average annual return of 11.8% from its start in 1985.
As we prepare for 2025, we can reflect on the market’s strongest consecutive years since the late 1990s. However, it’s important to note that we are currently classified as overvalued. The Nasdaq-100’s price-to-earnings (P/E) ratio stands at 31.3X, above the 10-year median of 25.3X. Despite this, high valuations do not necessarily signal the end of a bull market. Historical trends indicate that during extended bull markets, valuations can continue to rise, just as they can decline in bear markets driven by fear and greed.
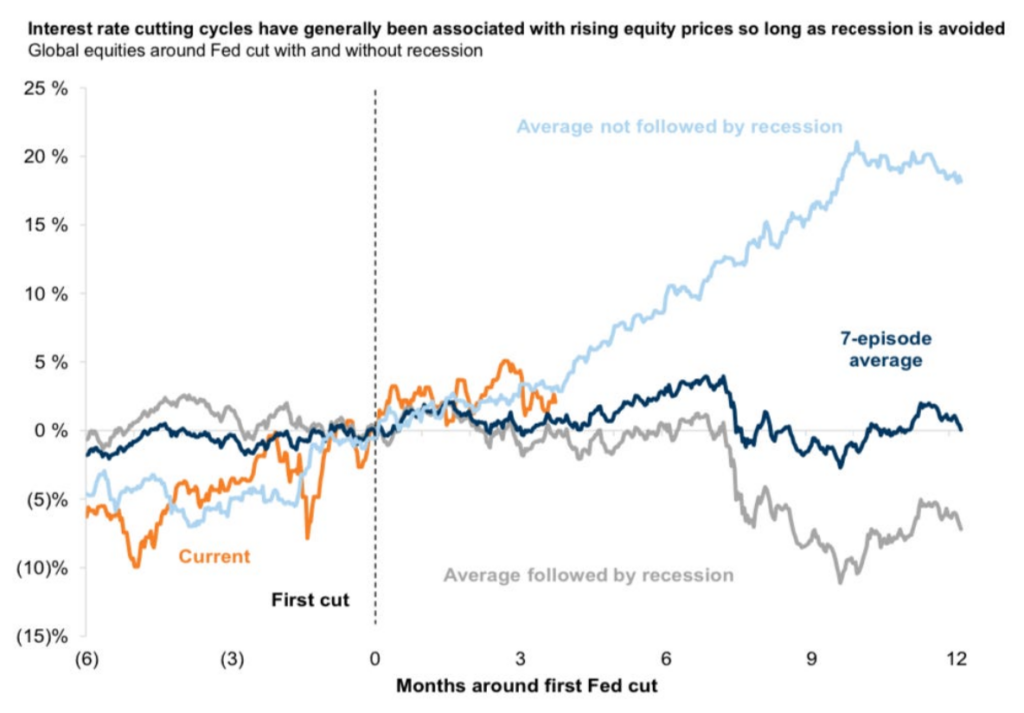
During former President Trump’s tenure, I anticipate that the Federal Reserve will continue to lower interest rates. When combined with a strong economy, this situation may lead to substantial growth, as historical data suggests the potential for double-digit returns.

However, I expect greater market volatility in 2025 compared to the previous two years. In 2023 and 2024, the largest dip for the index was 10%, occurring once in July 2023 and again in August 2024. Historically, bull markets see an average decline of 12-15%, as noted by JPMorgan Chase.
In addition, the historically unpredictable nature of an evolving political landscape during Trump’s presidency could lead to erratic Nasdaq-100 returns throughout 2025.
This brings us to the NEOS Nasdaq-100 High Income ETF (QQQI) — a strategy I’m adopting to navigate volatility in 2025 while retaining potential upside.
Understanding QQQI
The NEOS Nasdaq-100 High Income ETF (QQQI) operates as a covered call ETF, aiming to provide investors with high monthly income. It achieves this by investing in the Nasdaq-100’s underlying assets and applying a data-driven call option approach.
QQQI distinguishes itself from competitors like JEPQ and QYLD in several ways.
Notably, QQQI includes all 100 companies in the Nasdaq-100 index. There is no selection bias as fund managers do not pick and choose stocks. Investors have full transparency about what they hold.
Moreover, QQQI’s data-driven strategy relies on Nasdaq-100 Index Options, offering two significant advantages:
- These options fall under Section 1256 contracts per IRS guidelines. This classification means that all income derived from these contracts is taxed at 60% long-term capital gains and 40% short-term capital gains, regardless of how long they are held.
- The fund’s managers proactively manage losses to offset gains either from options or equity positions. This strategy can lead to fund distributions being classified as “Return of Capital,” which are not taxable in the year received. Instead, taxes are deferred until the investor sells the ETF, particularly beneficial for those aiming to minimize their tax burden.
In contrast, JEPQ’s approach, which involves equity-linked notes (ELNs), results in ordinary income taxation, a less favorable outcome for investors.
Furthermore, unlike QYLD, QQQI only sells call options on 75-90% of its portfolio value. This allows an unencumbered 10-25% of the fund to fluctuate with the market, giving it more potential for profit than the restricted growth experienced by QYLD investors.
For instance, in April and July of 2024, the QQQ saw an 18.5% rise, while QYLD only increased by 4.4%. In contrast, QQQI rose by 9.8%. The strategic limitation on the options sold allowed QQQI to generate a 5.4% outperformance over QYLD during that timeframe. Additionally, QQQI investors received $2.44 per share during that three-month period, which equates to roughly a 5.0% yield.
QQQI’s Performance in the Bull Market
QQQI launched on January 30, 2024, starting at $50 per share. With a full year of data now available, let’s examine its performance.
Over one year, QQQI reported a total return of 22.7%.
During this period, QQQI distributed $7.33 per share to its investors. If you had purchased one share at $50 when it started, that results in a 14.7% annual distribution yield.
The share price increased by 8.3%, and when combined with the yield, QQQI captured a substantial 95.8% of the Nasdaq-100’s total return over the same time frame.
Overall, QQQI has performed admirably in this bull market, securing nearly 96% of its benchmark index returns. Its primary goal is to provide high, tax-efficient monthly income, which it successfully achieved with a 14.7% yield in its inaugural year.
QQQI’s Anticipated Response to Market Volatility
So, how will QQQI and other covered call ETFs handle future volatility?
To understand this, we must first identify the causes of potential volatility.
For JEPQ, their fund managers…
“`
Understanding JEPQ, QYLD, and QQQI: Strategies for Market Stability
JEPQ’s Stock Performance and Investor Returns
Investors in the JEPQ ETF have the flexibility to buy and sell specific stocks within the fund, which aims to reduce the effects of market volatility. JEPQ first started trading on May 4, 2022, at a price of $50.10 per share. However, by October 13, 2022, its value dropped significantly, reaching a low of $39.61—a loss of 20.8%. Despite this sharp decline, JEPQ still provided its investors with cumulative distributions of $2.06 per share, translating to a yield of 4.1% based on its initial price.
Comparative Performance with QQQ
During the same time frame—from May 4, 2022, to October 13, 2022—investors in QQQ experienced a similar decline, with shares falling by 20.3%. This indicates that JEPQ’s strategy did not effectively mitigate price volatility compared to QQQ.
Risk Profiles of QYLD and QQQI
Contrastingly, QYLD does not use a proprietary stock selection method; it simply holds the assets within its index. Thus, if QYLD is to outshine QQQ during bear markets, it must rely solely on providing consistent monthly yields, as both funds hold identical securities.
In this theoretical landscape, QQQI should follow a similar trend as QQQ during downturns, with its returns enhanced only by its monthly income. Notably, QQQI offers an annual distribution yield of 14.7%, while QYLD provides a lower yield of 12.7%, establishing a 2% advantage for QQQI.
The Potential Advantage of QQQI Going Forward
When we factor in the historical 5.4% outperformance of QQQI during the rising market from April to July 2024, there exists a promising opportunity for QQQI to significantly outperform competitors while also offering a tax-efficient monthly income to cushion any potential declines in 2025.
Outlook for 2025
Looking ahead, predicting the fate of the Nasdaq-100 in 2025 remains challenging. Historical data suggests that the index could be overvalued, yet market dynamics can often elevate valuations beyond expectations driven by investor enthusiasm. Given the relative stability of 2023 and 2024, it is possible that we may see multiple significant pullbacks in the Nasdaq-100 this year.
If such declines occur, maintaining shares of QQQI in one’s portfolio could be a strategic response. The consistent income generated by QQQI can offset potential price dips, while its data-driven covered call strategy allows for price appreciation during upward market movements.
Combining reliable monthly income to offset price declines with the potential for gains in a rising market sets up an appealing strategy for navigating the challenges of 2025.
Disclaimer: This article does not offer financial advice or investment recommendations. It serves purely as informational content, and readers should not interpret it as legal, tax, or investment advice. I hold a beneficial long position in BTCI, SPYI, QQQI, and IWMI, either through stocks or derivatives. This article reflects my own opinions, and I am not receiving any payment for its publication. I have no business connections with any of the mentioned companies. Past performance is not indicative of future results, and no advice is being given regarding the suitability of any investment for individual investors.
© 2025 Benzinga.com. Benzinga does not provide investment advice. All rights reserved.