PCE Report Reveals Inflation Insights Amid Market Volatility
The latest inflation report, the Personal Consumption Expenditures (PCE) Price Index, has met market expectations. This alignment works in favor of investors, as it limits reasons for bearish pressure on stock prices.
However, there’s a caveat. The report indicates inflation remains significantly above the Federal Reserve’s target of 2%. This situation suggests that interest rate cuts are not imminent.
Specifically, the PCE index increased by 0.3% in January, yielding a year-over-year rate of 2.5%. In addition, the Core PCE, which excludes food and energy prices, also rose by 0.3% for the month, bringing its annual rate to 2.6%. Notably, all these figures align with consensus estimates.
Consumer Spending and Income Trends
A deeper look at the report reveals significant shifts in consumer income and spending. As noted by CNBC:
Personal income increased by a sharper-than-expected 0.9% for the month, contrasting with forecasts of a 0.4% rise.
Despite the rise in income, consumer spending fell by 0.2%, against an anticipated modest gain of 0.1%.
The personal savings rate has also surged, climbing to 4.6%.
This data points to a broader trend of fear and uncertainty in the markets. Topics such as interest rates, tariffs, inflation, and public policy create many questions, which may weigh heavily on stock performance.
Expect Persistent Market Volatility
Market volatility appears to be the norm, as highlighted by Luke Lango, an expert in hypergrowth investing and editor of Innovation Investor.
As Lango summarizes:
Stocks have experienced significant fluctuations recently, with the S&P 500 achieving 5% gains alongside a negative performance in the small-cap Russell 2000.
Is this extreme volatility Wall Street’s new normal?
It may well be.
I anticipate stock prices will trend upwards in 2025, though this rise won’t be straightforward, mainly due to the unpredictability surrounding U.S. policies.
Lango emphasizes that investors must brace for continued market volatility:
Two steps forward, one step back; this is the pattern we expect for the foreseeable future.
While volatility can disturb short-term traders, it might also provide long-term investors with favorable buying opportunities.
A Potential Bullish Signal from Jeff Clark’s Indicator
For readers new to the Digest, Jeff Clark is a seasoned market analyst with over 40 years of experience. Through his services, including Jeff Clark Trader, he trades successfully in various market conditions.
He employs momentum indicators and moving averages to forecast market trends. Recently, one indicator suggests a potential bullish breakout may be on the horizon.
Here is a key excerpt from Jeff’s Wednesday update:
The Volatility Index (VIX) is poised to generate its first “buy” signal of 2025.
In 2024, the VIX produced eight buy signals, all aligning with short-term market lows in the S&P 500, typically resulting in rallies of at least 100 points.
This VIX indicator activates when it closes above its upper Bollinger Band and then reverts back inside the bands. Bollinger Bands are tools that help assess stock volatility, thereby aiding in trade timing.
Jeff further explains the implications of these Bollinger bands in relation to the VIX:
When charts move outside Bollinger Bands, it suggests an extreme condition that may signal a reversal.
Last time this happened was mid-December, when the S&P 500 was trading near 5880 and climbed above 6000 shortly after the signal was generated.
As of Monday, the VIX closed above its upper Bollinger Band—marking a notable moment in the market. Below is a chart depicting this status, courtesy of Jeff’s update.
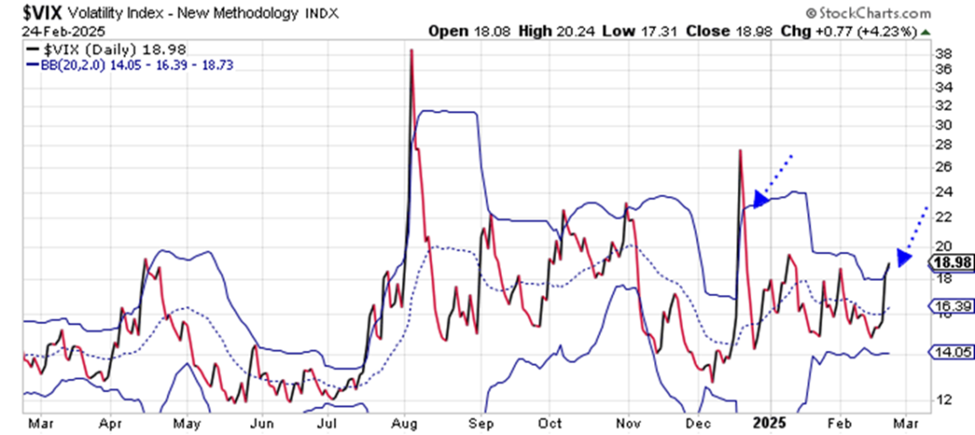
Source: StockCharts.com
The VIX Indicator Signals Potential Bullish Turn Amid Recession Concerns
The VIX, often referred to as the “fear index,” is approaching a buy signal. As I write this Friday morning, using a 6-month timeframe allows us to clearly observe the movement. Currently, the VIX reading has dipped just below the upper Bollinger Band, indicating potential changes ahead.
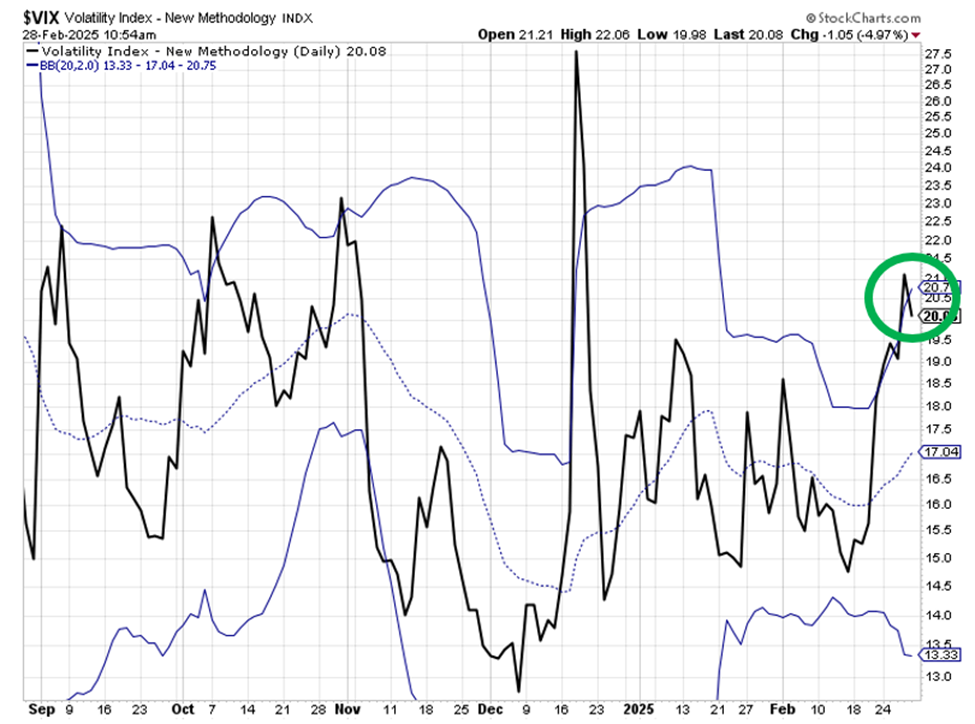
Source: StockCharts.com
According to Jeff, we need the VIX to close within the Bollinger Bands today for an official buy signal. So far, the indicators are trending positively, suggesting that the VIX may be close to turning bullish.
We will continue to report on this development.
Fed’s Recession Indicator Shows Movement
Shifting focus to the macroeconomic landscape, the Fed’s preferred recession indicator triggered this past Wednesday.
To clarify, we are not predicting a recession at this time. However, it’s critical for investors to stay informed of market signals.
Recently, the yield on 10-year Treasury notes fell below that of the 3-month note, creating what is known as an “inverted yield curve.” While we usually analyze the 10-year versus 2-year yields, the Fed favors the 10-year to 3-month yield curve due to its sensitivity to the fed funds rate.
The New York Fed specifically uses this inverted relationship to estimate recession probabilities over the next 12 months. As of last month, this probability was recorded at 23%…
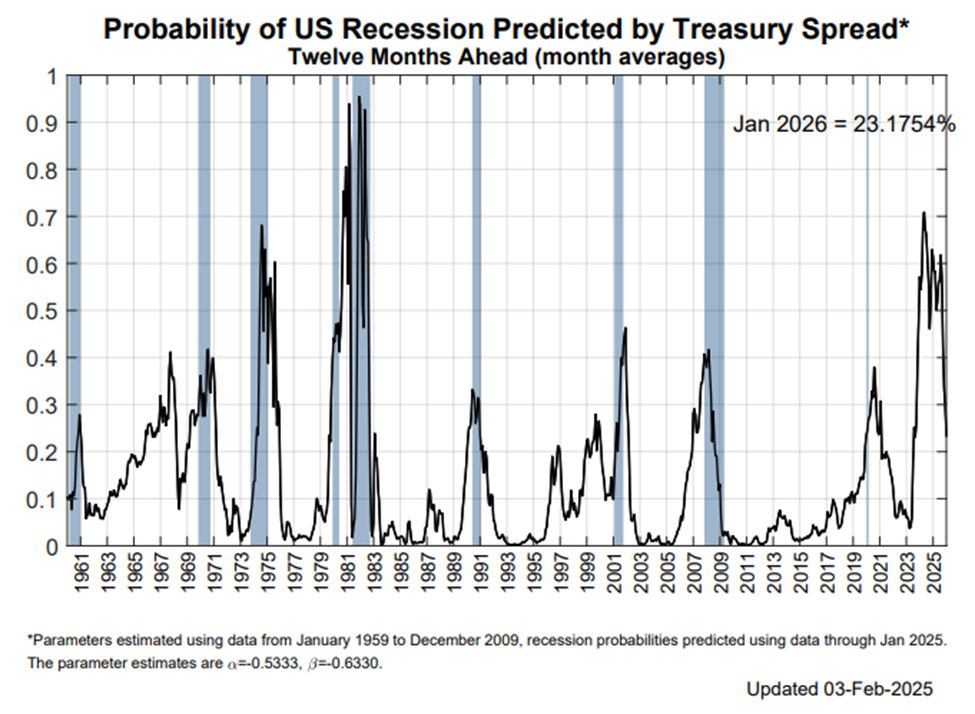
Source: Federal Reserve data
This indicator is poised for change.
As reported by CNBC, [The 23% recession probability] is almost certain to adjust as the relationship has shifted significantly this February.
The reason this shift is viewed as a recession indicator is based on the expectation that the Fed might reduce short-term rates in response to an economic downturn.
Earlier this week, we noted that renowned investor Louis Navellier anticipates the Fed will implement four quarter-point rate cuts this year. Depending on how Wall Street interprets these cuts, they could either steepen or normalize the yield curve.
Rate cuts can signal that the Fed is managing the economy effectively, but they might also raise concerns that the Fed is reacting too late to economic signals.
While observing these trends, it’s important to remember that an inverted yield curve does not automatically indicate a recession. This section of the yield curve has been inverted for most of 2023 and 2024, reverting to a positive state in mid-December 2024. Therefore, while it’s worth monitoring, we should not panic.
We will keep you updated and will report further.
Positive Market Seasonality Ahead
For those feeling anxious about recent market declines, it’s essential to keep in mind that historical data shows this is typically a weaker period for market returns.
The S&P 500’s seasonality chart illustrates average returns throughout the year, revealing a trend of poor performance during this time.
The key takeaway? Historically, this period tends to be challenging, so now may not be the ideal time to liquidate stock holdings.
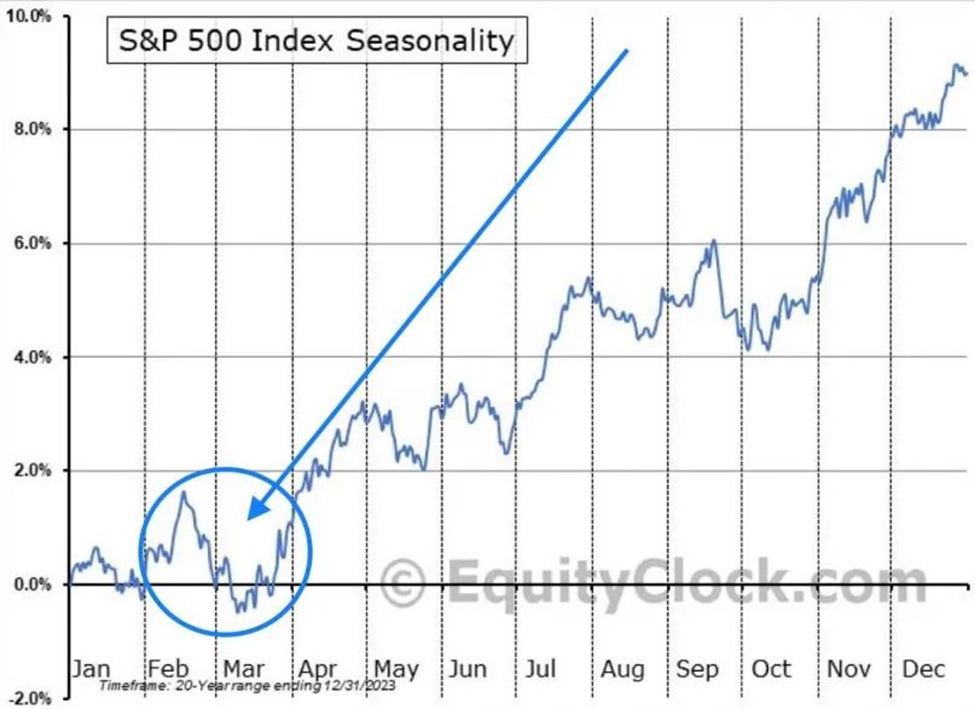
The encouraging news is that if historical patterns hold, we may experience another week of softness in the markets before transitioning into a stronger bull phase leading up to May.
This forecast aligns well with Luke’s volatility insights and Jeff’s VIX Indicator update.
In conjunction with seasonality, earlier this year we highlighted a new Seasonality Tool introduced by our corporate partner, TradeSmith. This tool identifies historical price patterns relevant to specific stocks.
Recently, Keith & Co. launched an advanced suite of quant tools and identified an unusual market pattern signaling a potential bullish melt-up, despite the recent market fluctuations.
Thousands of investors participated in an informative evening with Keith. If you missed it, you can catch a free replay here. It features:
- Details on the algorithm indicating the current bull signal
- Ten stocks poised to benefit from a market melt-up
- Ten “big name” stocks to consider selling immediately
- Guidance on leveraging TradeSmith’s innovative tools for optimal profit potential
We will continue to provide you with updates on these developments here in the Digest.
Have a good evening,
Jeff Remsburg