Understanding the Fragmented Dynamics of U.S. Equity Trading
Throughout this year, we’ve published several blogs analyzing the increase in off-exchange trading and the continuing fragmentation within on-exchange trading. The trend illustrates that while on-exchange share diminishes, the overall landscape of trading is evolving.
Today, we revisit one of our preferred charts that highlights how orders are routed, where trades execute, and the economic incentives that drive various components of market structure to attract participants.
The U.S. equity market can be viewed as three interconnected segments. This separation involves retail, mutual funds, and arbitrage traders, each with unique characteristics. Consequently, this segmentation typically results in less “accessible” liquidity than the total volume numbers might imply.
Analyzing the U.S. Market: Three Distinct Segments
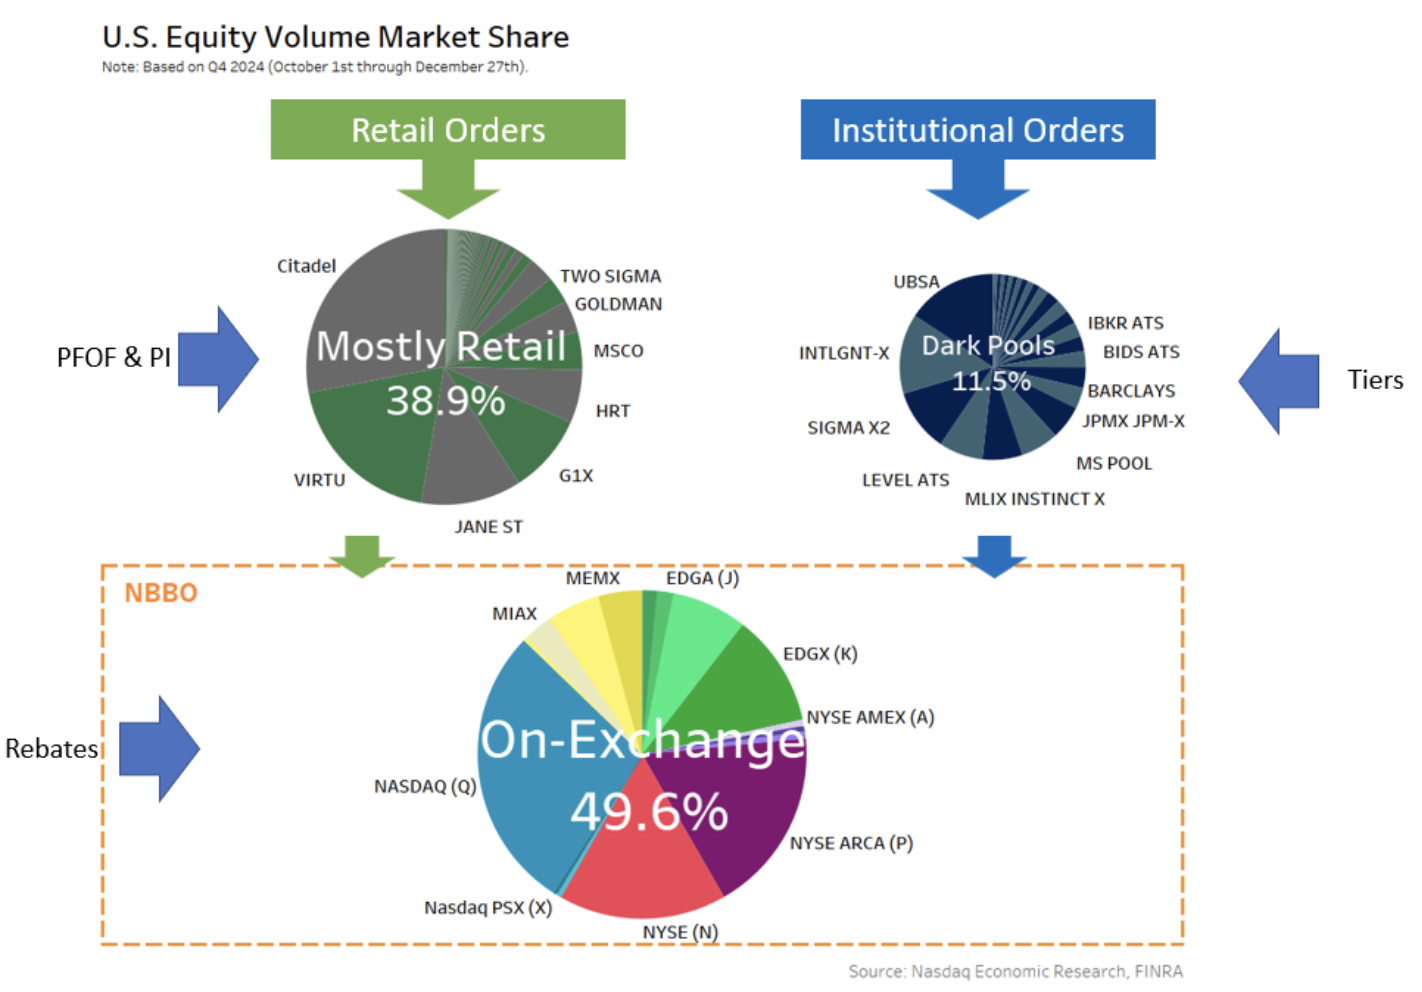
The chart below illustrates the current market shares of each segment in the U.S. market structure. Each circle is proportional to its contribution to overall trading volume. Approximately five years ago, 65% of total market volume was executed on exchange, but as volume shifts into non-lit venues, the economics of trading have also transformed.
As we will explain, the rules governing market behavior, trading economics, and how brokers handle orders demonstrate that each segment operates quite differently from the others.
Chart 1: Order Flow and Market Share in the U.S. Stock Market
 Stock market” width=”573″ height=”400″>
Differentiated Trading Rules Across the Market
The rules and conventions for trading differ significantly among the three segments.
1. Retail Segment
This segment, referred to as “mostly retail,” includes various bilaterally agreed trades. These encompass trades between Single Dealer Platforms, other brokers, and blocks negotiated by investors. Research indicates that retail is the largest contributor within this segment, but it is not the sole driver of off-exchange growth.
Retail brokers generally route orders to wholesalers. Due to typically small and random retail orders, it is easier to profit from filling a retail spread crossing order compared to an arbitrage spread. Therefore, retail orders often get filled before reaching exchanges at superior prices, known as sub-decimal prices, which are better than the limit orders within dark pools and exchanges.
This price improvement creates a strong economic incentive for trading within this segment. Additionally, wholesalers may pay for order flow that proves highly profitable.
2. Dark Pools Segment
Investment banks typically handle mutual fund trades and employ algorithms to dissect large orders to minimize their market impact. They also operate their own dark pools to facilitate order crossing away from main exchanges.
Unlike retail trade practices, dark pools must trade “on tick” or frequently at midpoint using the National Best Bid and Offer (NBBO) sourced from exchanges. This approach reduces exchange fees for brokers while generating revenues from trading and market data.
Segmentation allows for better spread capture, enticing some customers to pay higher trading fees. However, both the retail and dark pool segments lack transparency. Prices are often non-public, relying instead on NBBO. Furthermore, trade fees can vary significantly, and transactions may be free or bundled with other services, making trade locations anonymous.
3. Exchanges Segment
When liquidity is unavailable within broker-run pools, orders typically enter the public markets. Exchanges, like dark pools, must trade on tick or at midpoint. However, they operate with a “fair access” principle, meaning they do not discriminate based on profitability or allow customer segmentation. Factors such as speed bumps, fees, and rebates do influence trading economics within exchanges.
It is important to recognize that exchanges serve additional essential functions in the overall ecosystem. They publish best prices used across the industry to safeguard investors from unfavorable fills, while also listing and offering needed services to public companies seeking market access.
Table 1: Key Trading Rules Across Segments
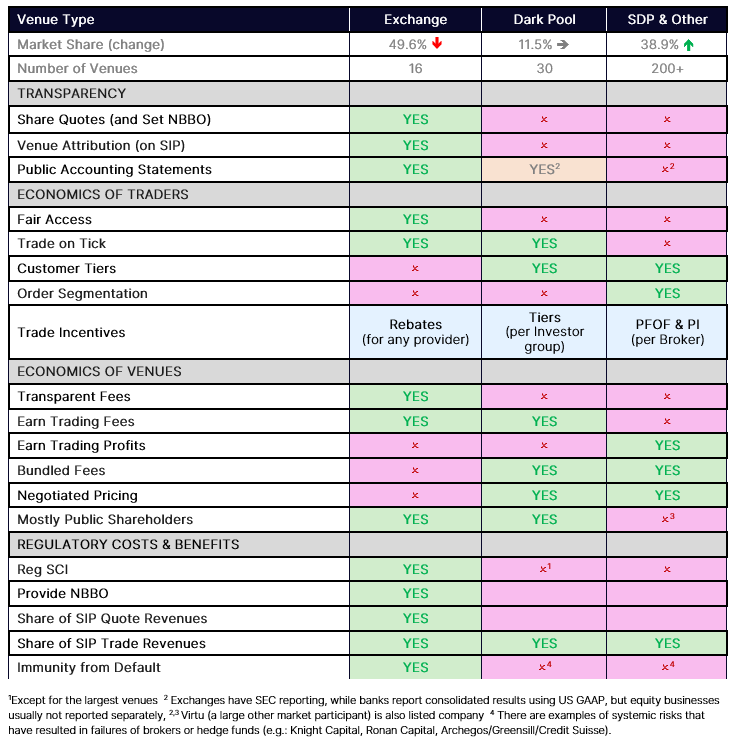 trading in each pie are quite different” width=”397″ height=”400″>
The Fragmentation of the U.S. Stock Market
The data clearly illustrates that the U.S. Stock market is not only exceptionally fragmented but also segmented at the order arrival point.
This fragmentation impacts the economics surrounding “positive externalities,” such as increasing the number of IPOs and establishing protective pricing for investors. It shifts the economic advantages from those providing the NBBO to those executing trades in segmented venues, thereby diminishing the liquidity accessible to the entire market. Additionally, it complicates direct trading interactions between retail and institutional investors.
The complexities of the U.S. market structure create an uneven playing field for all participants.