Netflix Expected to Report Strong Q1 2025 Earnings on April 17
Netflix (NASDAQ:NFLX) is scheduled to report its Q1 2025 earnings on Thursday, April 17, 2025. Analysts project a revenue increase of approximately 12% to around $10.5 billion, with earnings anticipated to be about $5.73 per share. This growth stems from Netflix’s robust subscriber additions over the past year, which exceeded 40 million in 2024, as well as recent price increases. In January, Netflix raised the price of its standard HD plan by $2.50 to $18 per month and the Premium plan to $25 per month.
Subscriber Growth and Market Challenges Ahead
In 2024, Netflix experienced notable subscriber growth driven by its crackdown on password sharing and the launch of its ad-supported plan. However, experts caution that this momentum may taper off in 2025. Increased competition in the streaming market could result in higher churn rates or decreased new sign-ups. Additionally, the company’s decision to stop disclosing subscriber counts may indicate it expects slower growth in the coming year.
Content Costs and Profit Margins to Watch
This quarter, attention will also be on Netflix’s profit margins. As the company expands into live sports, such as NFL and WWE programming, its content costs are expected to rise. These higher expenses could impact overall profitability, making it crucial for investors to keep an eye on margin performance.
Financial Overview
Netflix boasts a current market capitalization of $404 billion. Over the past twelve months, it generated $39 billion in revenue, achieving $10 billion in operating profits and a net income of $8.7 billion. For those seeking investment opportunities with lower volatility than single stocks, the Trefis High-Quality portfolio offers a compelling alternative; it has outperformed the S&P 500 and amassed returns over 91% since its inception.
Analyzing Historical Earnings Performance
Netflix’s Historical Odds of Positive Post-Earnings Returns
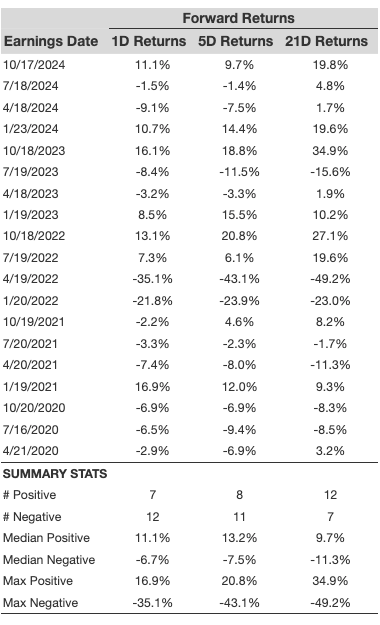
We can assess Netflix’s earning performance based on data collected over the last five years:
- Out of 19 recorded earnings events, there were 7 positive and 12 negative one-day (1D) returns, leading to a 37% occurrence of positive responses.
- This percentage rises to 55% if we refine our analysis to the last 3 years.
- The median of the 7 positive returns is 11%, while the median of the 12 negative returns stands at -6.7%.
The table below presents additional statistics for observed 5-Day (5D) and 21-Day (21D) returns following earnings reports.

Correlation of Historical Returns
Understanding the correlation between short-term and medium-term returns can inform safer trading strategies post-earnings. Traders might consider the highest correlations between 1D and 5D returns. For instance, if a positive 1D return follows an earnings announcement, a trader may choose to position themselves “long” for the subsequent 5 days. The following correlation data reflects assessments from both a 5-year and a 3-year perspective, with a particular focus on the correlation between 1D and 5D post-earnings returns.

Investors seeking a high-quality stock alternative that boasts strong returns while mitigating risk can look into Trefis’ RV strategy, which has consistently outperformed all-cap stock benchmarks. If you prefer a smoother investment experience compared to individual stocks like Netflix, consider the Trefis High Quality portfolio, yielding over 91% in returns since its launch.
Invest with Trefis Market-Beating Portfolios
See all Trefis Price Estimates
The views and opinions expressed herein are the views and opinions of the author and do not necessarily reflect those of Nasdaq, Inc.