Bank of America Set to Announce Earnings Amid Economic Uncertainty
Bank of America (NYSE:BAC) is set to release its earnings report on April 15, 2025. According to consensus estimates, the bank’s revenue is projected to be about $26.9 billion—an increase of 4% from last year. Analysts estimate earnings at approximately $0.82 per share, which may benefit from slightly higher net interest income. However, the performance across other segments may present a mixed picture. In the fourth quarter, the bank’s investment banking division performed strongly; yet, this segment could face challenges in the first quarter as economic uncertainty and escalating trade tensions prompt companies to reconsider their deal-making activities. Currently, Bank of America holds a market capitalization of $277 billion, with total revenue over the past twelve months at $102 billion and net income around $27 billion.
Investors are likely to scrutinize the bank’s outlook on the economy. U.S. markets have experienced turbulence lately, particularly following President Donald Trump’s announcement of broad tariffs impacting over 100 countries. Although he paused the rollout on Thursday, market conditions remain precarious due to the ongoing trade conflict with China. These factors raise concerns about potential inflation and a possible economic downturn, which may adversely affect the banking sector. Financial institutions might find themselves needing to increase reserves for potential loan losses, thereby impacting overall profitability. Furthermore, higher economic risks could result in banks scaling back on lending activities. Year-to-date, Bank of America’s stock has declined by about 19%. For investors seeking stability paired with potential upside, Trefis’ High-Quality Portfolio offers an alternative, having outperformed the S&P 500 and delivering returns exceeding 91% since launch.
See historical earnings reaction of all stocks
Bank of America’s Historical Odds of Positive Returns After Earnings
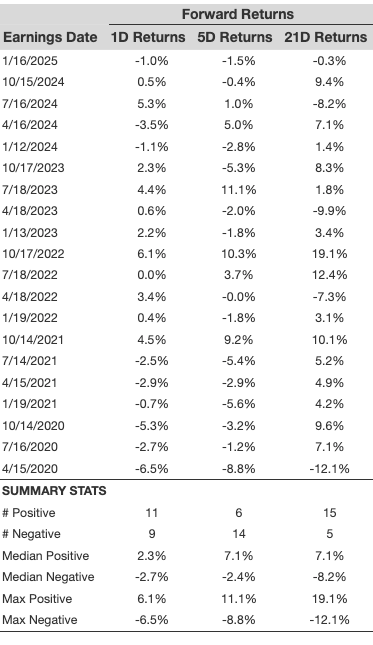
Insights into one-day (1D) post-earnings returns reveal the following:
- Over the last five years, 20 earnings events have shown 11 positive and 9 negative one-day returns, indicating a 55% chance of positive returns.
- Examining only the last three years, the rate of positive returns increases to 75%.
- The median positive return among the 11 instances is 2.3%, while the median negative return among the 9 instances is -2.7%.
Additional data for five-day (5D) and twenty-one-day (21D) returns post-earnings are summarized in the table below.
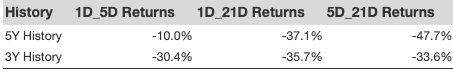
Correlation Between One-Day, Five-Day, and Twenty-One-Day Historical Returns
A relatively lower-risk strategy involves examining the correlation between short-term and medium-term returns following earnings announcements. Finding pairs with the highest correlation can inform trading decisions. For instance, if one-day returns and five-day returns have a high correlation, a trader could take a “long” position for the subsequent five days if the one-day post-earnings return is positive. The table below illustrates correlation data based on both five-year and more recent three-year histories. The term 1D_5D denotes the correlation between one-day post-earnings returns and subsequent five-day returns.
For more insights, explore the Trefis RV strategy, which has outperformed its all-cap stocks benchmark, consisting of the S&P 500, S&P Midcap, and Russell 2000, delivering robust returns for investors. If you prefer stable growth opportunities over a single stock like Bank of America, consider the High Quality portfolio that has consistently surpassed the S&P 500, achieving returns greater than 91% since its inception.
Invest with Trefis Market-Beating Portfolios
Check out Trefis Price Estimates
The views and opinions expressed herein are those of the author and do not necessarily reflect the opinions of Nasdaq, Inc.
5 Stocks Our Experts Predict Could Double In the Next Year
By submitting your email, you'll also get a free pivot & flow membership. A free daily market overview. You can unsubscribe at any time.