
Stay informed to stay ahead in today’s market.
Nvidia Faces $5.5 Billion Charge Amid Trade Talks
Market Response to Trade Developments
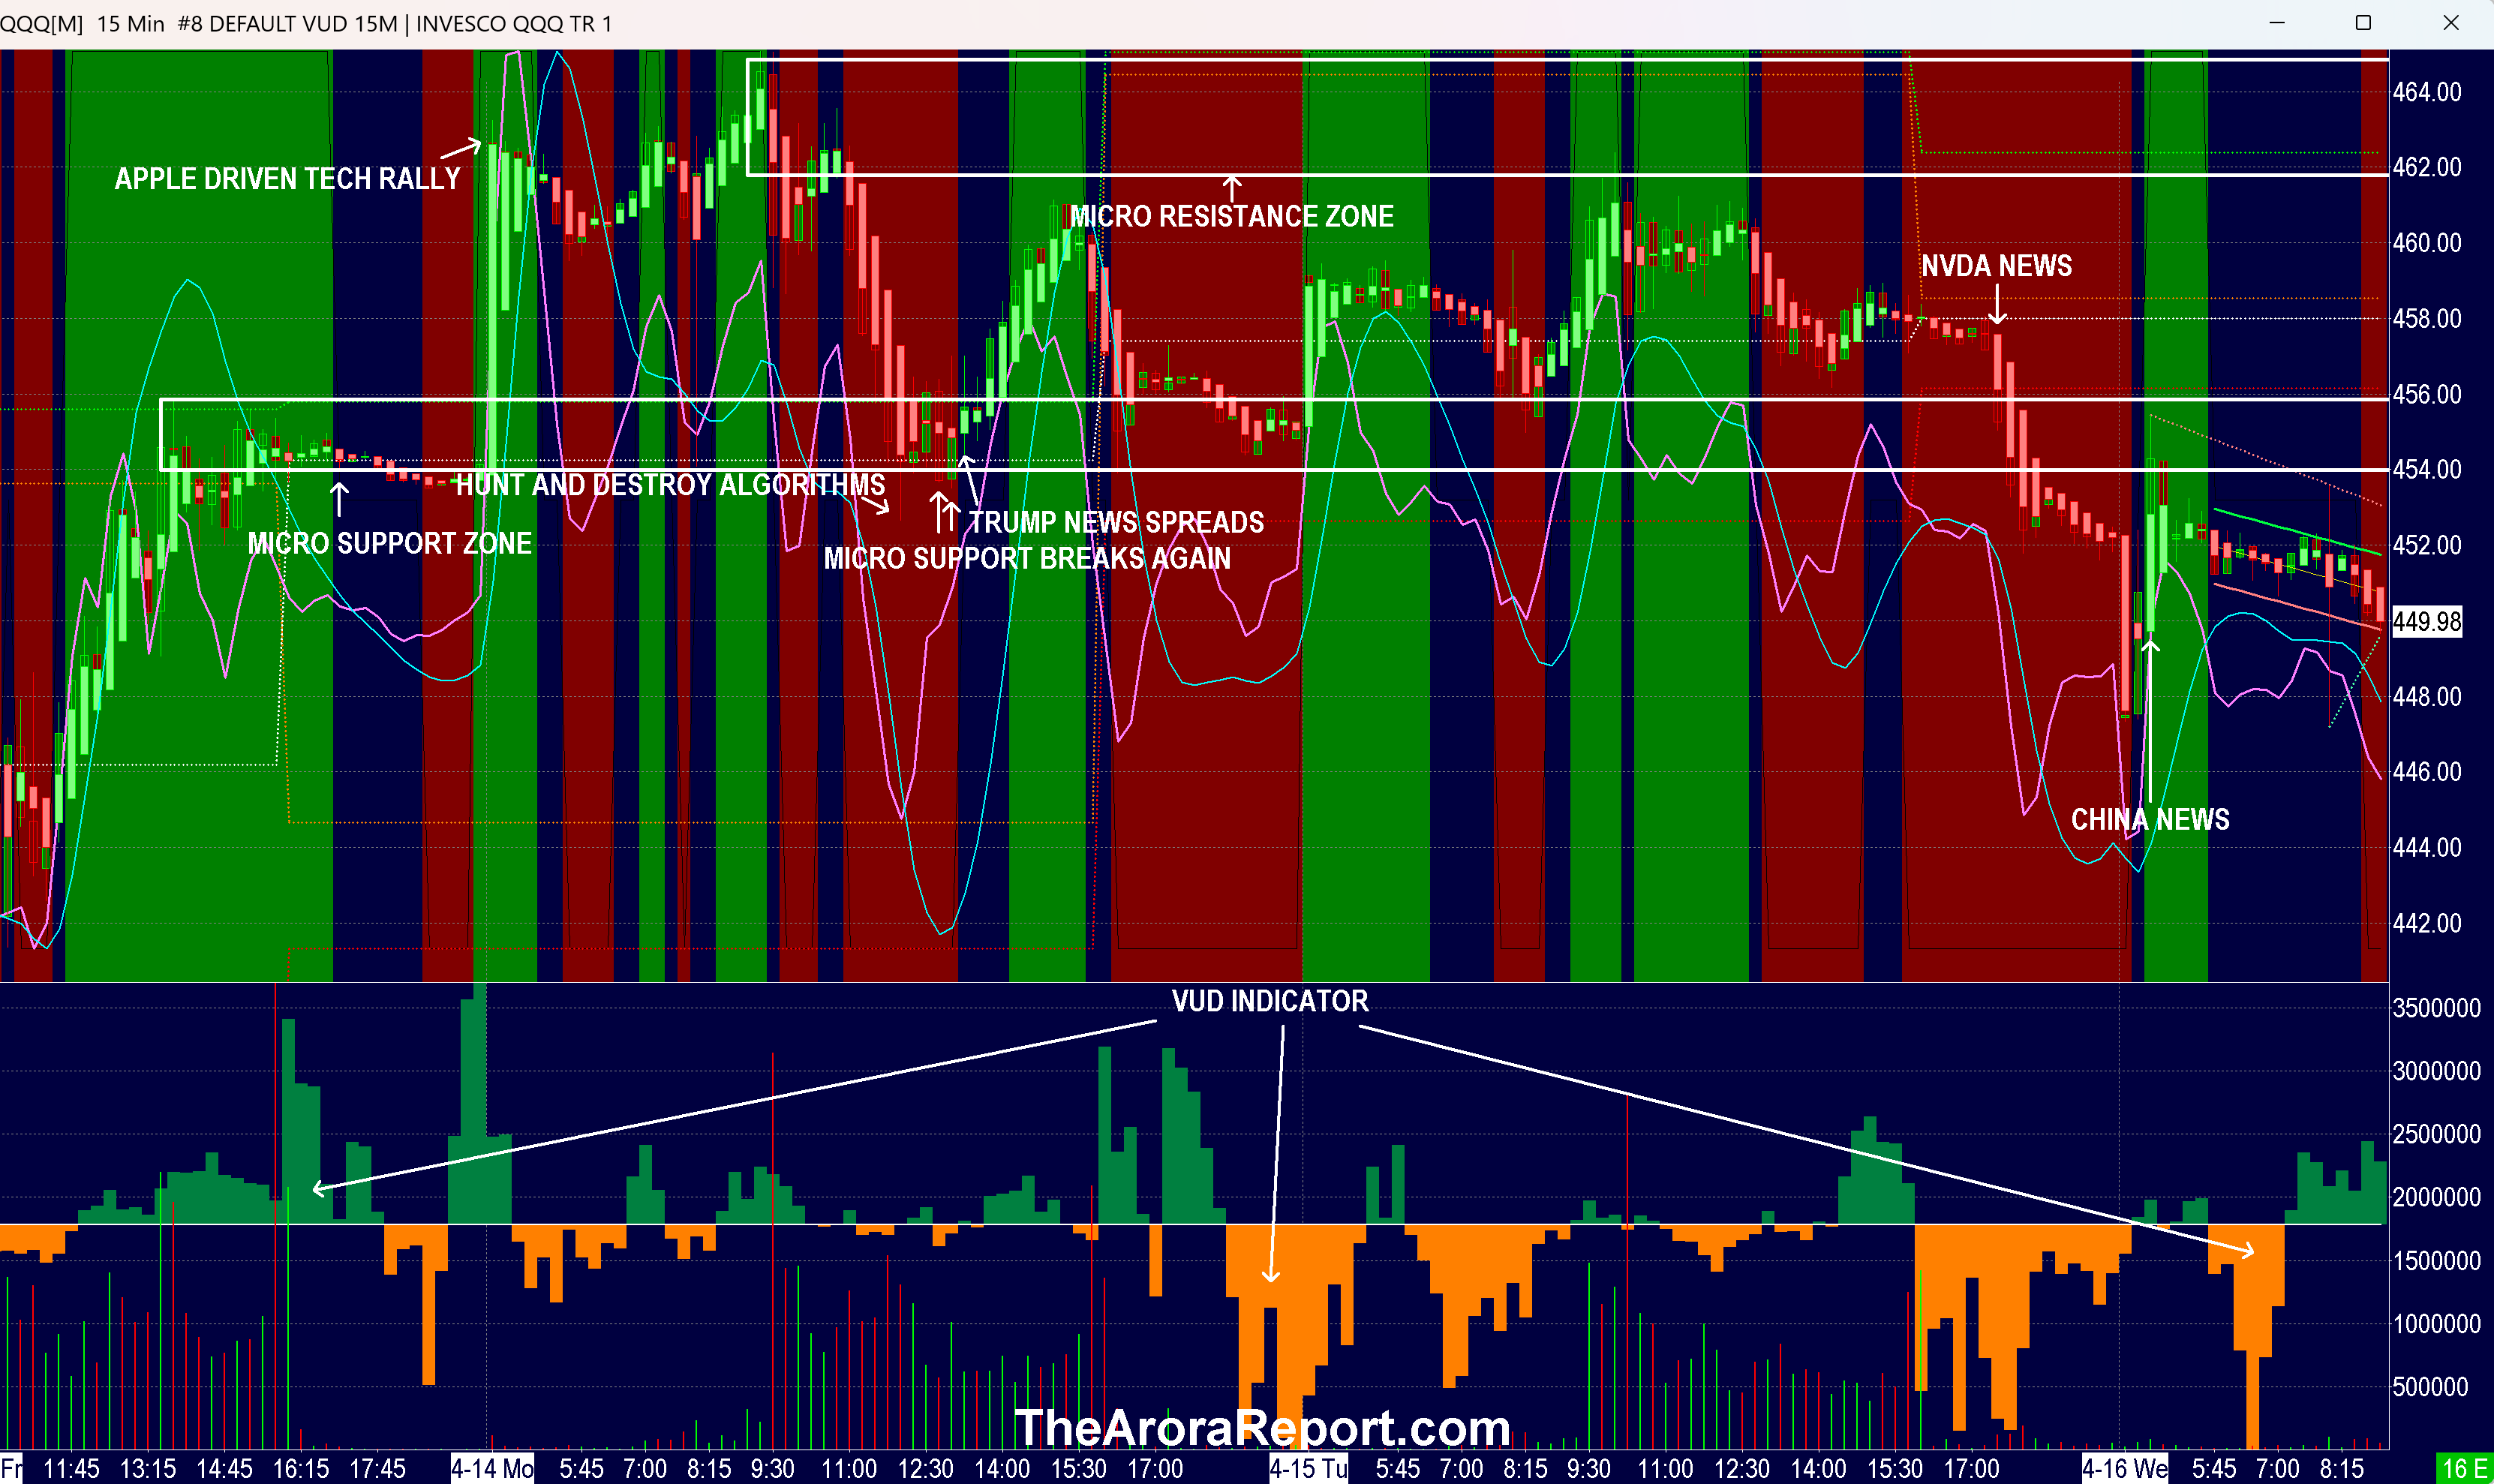
For a detailed look, please click here to view an enlarged chart of the Invesco QQQ Trust Series 1 (QQQ).
The following observations are key:
- The chart indicates that after hours trading yesterday caused QQQ to fall below its micro support zone, which has now transitioned to form a new lower resistance zone.
- This morning, QQQ briefly rallied due to positive news from China.
- However, QQQ later slipped below its previous micro support zone, reversing any gains.
- Markets are experiencing mixed signals as highlighted in today’s key updates:
- China is initiating talks to address ongoing trade issues, which has led to increased optimism for favorable outcomes.
- Trade discussions with Japan commence today, with expectations of positive developments.
- Conversely, the U.S. Commerce Department has implemented a new licensing requirement for NVIDIA Corp. (NVDA) regarding its H20 and Advanced Micro Devices Inc. (AMD) MI308 products, resulting in Nvidia incurring a $5.5 billion charge.
- ASML Holding NV (ASML), the largest provider of extreme ultraviolet lithography equipment, reported earnings today, exceeding revenue expectations but issuing less encouraging guidance. The company expressed concern over increasing uncertainty due to recent tariff announcements, stating the macro environment remains dynamic.
- On Monday, we updated you about China’s suspension of rare earth mineral exports. In response, President Trump has ordered an investigation into possible tariffs on critical mineral imports. Notably, China is the leading producer of 30 out of 50 critical minerals. MP Materials Corp (MP), a significant American rare earth miner, is part of The Arora Report’s ZYX Buy Core Model Portfolio.
- Given these dynamic conditions, investors should consider strategies like dynamic hedging, increasing cash reserves, investing in non-correlated assets like gold, and differentiating between strategic and tactical positions. Even if you haven’t adopted these measures yet, understanding them is vital for capitalizing on future opportunities. Consistency in applying these strategies over time is essential for long-term wealth generation.
- China’s Q1 GDP figures came in better than expected, with a quarter-over-quarter growth of 1.2% against a 1.4% consensus and a year-over-year growth of 5.4% versus a 5.2% consensus. However, we advise caution in interpreting this data as it predates the recent tariff hikes.
- The latest retail sales data showed unexpectedly strong results, reflecting the resilience of U.S. consumers despite ongoing uncertainties. Details include:
- Headline retail sales increased by 1.4% compared to a 1.3% consensus.
- Retail sales excluding auto sales rose by 0.5% versus a 0.2% expectation.
Money Flow Trends of Major Tech Stocks
In early trading, money flows were negative for major tech companies including Nvidia (NVDA), Apple Inc (AAPL), Amazon.com, Inc. (AMZN), Alphabet Inc Class C (GOOG), Meta Platforms Inc (META), Microsoft Corp (MSFT), and Tesla Inc (TSLA). Additionally, negative flows were observed in the SPDR S&P 500 ETF Trust (SPY) and Nasdaq 100 ETF (QQQ).
Monitoring Smart Money Movements
Investors can improve their insights by closely watching money flows in SPY and QQQ. Recognizing when smart money is investing in stocks, gold, and oil can provide significant advantages. The SPDR Gold Trust (GLD) is the most popular ETF for gold, while the iShares Silver Trust (SLV) is favored for silver, and the United States Oil ETF (USO) for oil.
Current Trends in Bitcoin
Bitcoin is experiencing selling pressure, consistent with trends in tech stocks.
Investment Protection Strategies
Investors are encouraged to look forward rather than backward. Our proprietary protection band synthesizes data, indicators, news, crosscurrents, models, and analyses into a format that investors can act upon.
Consider maintaining solid long-term positions. Depending on individual risk tolerance, a protection band might include cash, Treasury bills, and tactical trades, as well as short to medium-term hedges. This strategy allows you to protect your assets while still benefiting from potential market upsides.
Your protection bands can be defined by the amount of cash you hold compared to hedges. A higher band is suitable for conservative investors, while more aggressive investors may select a lower band. Should you decide not to hedge, make sure your cash levels are higher than the stated minimum but below the sum of cash plus hedges.
A protection band of 0% suggests bullish confidence, while a band of 100% indicates bearish sentiment necessitating strong protective measures or short selling.
Remember, to seize new market opportunities, maintaining sufficient cash reserves is crucial. When adjusting hedges, consider modifying stop quantities for stock positions, utilizing wider stops for high-beta stocks, which tend to be more volatile than the market average.
Evaluating Traditional Portfolios
Probability-based risk-reward assessments adjusted for inflation currently do not support a long-duration strategic bond allocation.
Investors adhering to a traditional 60% stocks and 40% bonds allocation should focus on high-quality bonds, particularly those with five-year durations or shorter. More sophisticated investors may utilize bond ETFs as tactical opportunities rather than traditional strategic holdings at this time.
The Arora Report has a history of providing accurate market predictions, including key calls during pivotal market movements in recent years. To receive ongoing insights, please click here to sign up for a free subscription to our Generate Wealth Newsletter.
Market News and Data brought to you by Benzinga APIs