Intuitive Surgical Earnings Report Set for April 22, 2025
Intuitive Surgical (NASDAQ: ISRG) will release its earnings report on Tuesday, April 22, 2025. For the last five years, ISRG stock has reacted positively on the day of earnings announcements in 58% of cases, yielding a median positive return of 9% and a peak return of 11%. Event-driven traders can leverage this trend in two main ways: first, by analyzing historical probabilities and positioning before the release, and second, by examining the connection between immediate and medium-term returns post-announcement to shape future trades.
From a fundamental perspective, ISRG is expected to benefit from robust global procedure volume growth and a rising adoption of its da Vinci 5 surgical systems. This optimistic outlook is backed by consensus estimates predicting earnings of $1.73 per share from sales totaling $2.19 billion for the upcoming quarter, which would increase from $1.50 per share on revenue of $1.89 billion in the same quarter last year.
As it stands, ISRG boasts a market capitalization of $174 billion. Over the last twelve months, the company reported $8.4 billion in revenue, accompanied by impressive operational profitability, achieving both an operating profit and net income of $2.3 billion each. For those seeking a less volatile investment path, the Trefis High-Quality portfolio offers a compelling alternative, having significantly outperformed the S&P 500 with returns exceeding 91% since its inception.
See earnings reaction history of all stocks
Historical Analysis of Intuitive Surgical’s Post-Earnings Returns
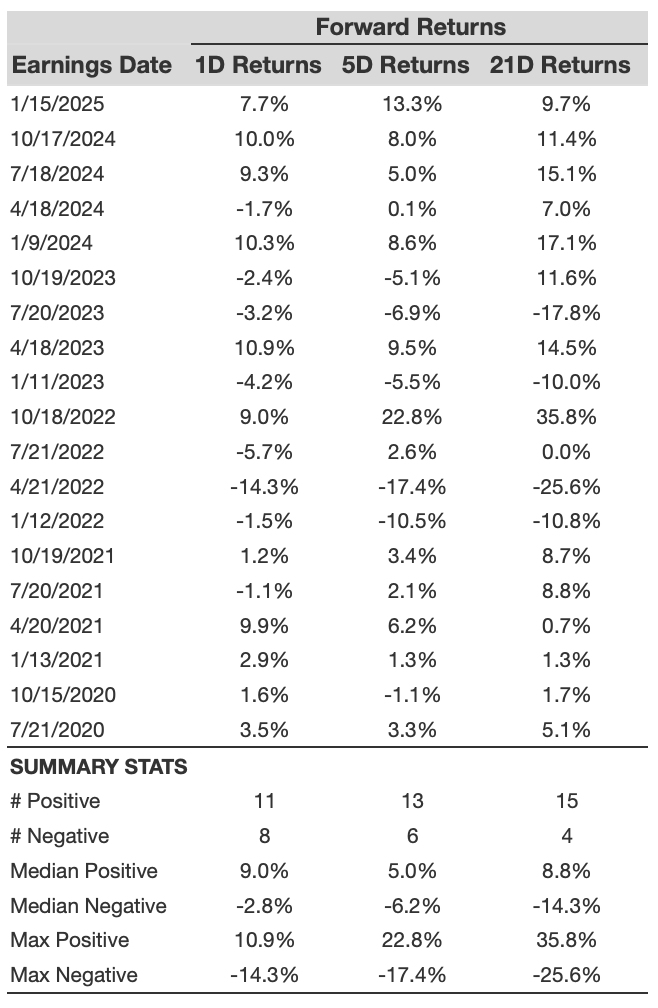
Examining one-day (1D) post-earnings returns reveals several key observations:
- Over the quintet of years analyzed, there are 19 data points showing 11 positive and 8 negative 1D returns, indicating that positive returns occurred approximately 58% of the time.
- In contrast, the percentage of positive returns drops to 50% when considering the past three years.
- The median of the 11 positive returns is 9.0%, while the median of the 8 negative returns stands at -2.8%.
Additionally, post-earnings returns for 5-Day (5D) and 21-Day (21D) periods are summarized in the table below along with relevant statistics.

ISRG observed 1D, 5D, and 21D post earnings returns
Analyzing the Correlation of Historical Returns
Understanding the correlation between short-term and medium-term returns post-earnings creates a less risky trading strategy. If the correlation is low, this method may not be beneficial. Traders should identify pairs with the highest correlation and execute corresponding trades. For instance, if the 1D and 5D returns show a tight correlation, a trader might take a long position for the next five days following a positive 1D return. Correlation data from both five-year and more recent three-year histories are shown here, with 1D_5D representing the link between 1D and subsequent 5D returns.

ISRG Correlation Between 1D, 5D, and 21D Historical Returns
Investors seeking a balanced investment strategy may want to explore Trefis RV strategy, which has regularly exceeded all-cap stocks benchmarks—inclusive of the S&P 500, S&P mid-cap, and Russell 2000—delivering robust returns. Moreover, for a smoother investment experience compared to a singular stock like Intuitive Surgical, the High-Quality portfolio remains an attractive option, boasting returns greater than 91% since its launch.
Invest with Trefis Market-Beating Portfolios
See all Trefis Price Estimates
The views and opinions expressed herein represent those of the author and do not necessarily reflect the views of Nasdaq, Inc.