SPDR S&P 600 Small Cap Growth ETF Experiences Notable Outflow
Today, we observed significant changes in shares outstanding within the ETF sector, particularly impacting the SPDR S&P 600 Small Cap Growth ETF (Symbol: SLYG). This fund reported a remarkable outflow of approximately $229.8 million, marking a 7.4% decline week over week as shares outstanding dropped from 40,100,028 to 37,150,028. Examining the largest underlying components, SPX Technologies Inc (Symbol: SPXC) declined by about 1.6%, while Armstrong World Industries Inc (Symbol: AWI) saw a decrease of roughly 1%. Additionally, Essential Properties Realty Trust Inc (Symbol: EPRT) fell by about 0.8%. For a full list of holdings, please visit the SLYG Holdings page »
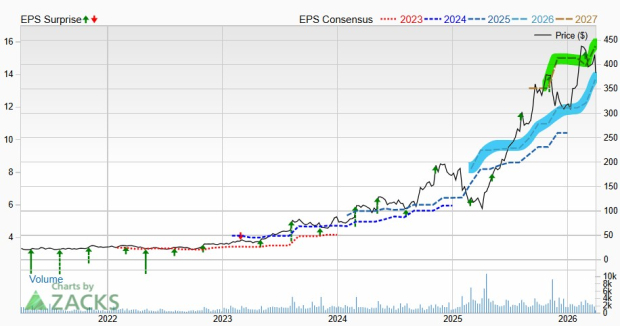
The chart below illustrates the one-year price performance of SLYG in relation to its 200-day moving average:

From the chart, SLYG’s price range over the past year shows a low of $71.6214 per share and a high of $101.6168, with the most recent trade recorded at $76.57. It is also worth noting that comparing the latest share price to the 200-day moving average can provide insights for technical analysis—learn more about the 200-day moving average ».
Free report: Top 8%+ Dividends (paid monthly)
Exchange-traded funds (ETFs) function similarly to stocks, but instead of purchasing “shares,” investors buy and sell “units.” These “units” can be exchanged like stocks, yet they can also be created or destroyed based on investor demand. Our weekly analysis tracks notable week-over-week changes in shares outstanding, allowing us to identify ETFs that are seeing significant inflows (indicating new units created) or outflows (indicating old units destroyed). The creation of new units necessitates purchasing the ETF’s underlying holdings, whereas the destruction of units entails selling those holdings. Therefore, substantial flows can also influence the individual components held within the ETFs.
![]()
![]() Click here to discover which 9 other ETFs experienced notable outflows »
Click here to discover which 9 other ETFs experienced notable outflows »
Also see:
- Prem Watsa Stock Picks
- ADC Next Dividend Date
- GMRE Market Cap History
The views and opinions expressed herein are the views and opinions of the author and do not necessarily reflect those of Nasdaq, Inc.