Comcast’s Upcoming Earnings Report: Challenges and Expectations
Comcast (NASDAQ:CMCSA) is preparing to report its earnings on Thursday, April 24, 2025. The company is anticipated to face several challenges this quarter, particularly due to heightened competition and slower growth in its core broadband segment. In the last quarter, Comcast experienced a significant broadband subscriber loss of 139,000 residential customers, largely attributed to fierce competition from telecom companies like T-Mobile. Furthermore, the company’s media division may encounter headwinds due to mixed consumer spending, which could negatively impact advertising revenue. The recent wildfires in Southern California are also expected to affect attendance at its Universal Studios park in Los Angeles, potentially squeezing profits from its theme parks segment.
Overall, consensus estimates predict that earnings for the quarter will reach approximately $0.99 per share, a decrease of about 5% year-over-year, while revenues are projected to remain flat at $29.8 billion.
As for market capitalization, Comcast currently stands at $131 billion. Over the past twelve months, the company reported $124 billion in revenue, maintaining operational profitability with $23 billion in operating profits and a net income of $16 billion. For investors seeking a less volatile investment option, the Trefis High-Quality portfolio has demonstrated solid performance, outperforming the S&P 500 and achieving returns exceeding 91% since its inception.
See earnings reaction history of all stocks
Comcast’s Historical Performance on Earnings Releases
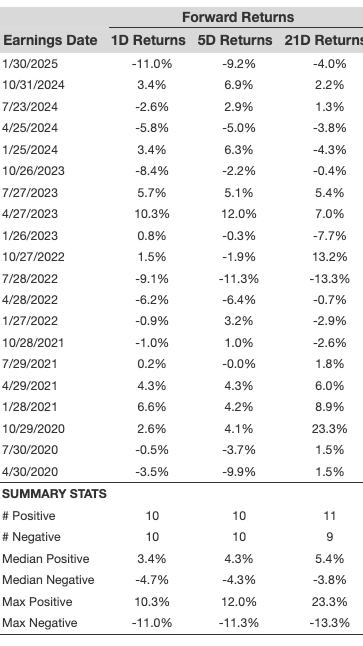
Examining the outcomes of Comcast’s earnings releases over the past five years reveals noteworthy trends in one-day (1D) post-earnings returns:
- Analysis of 20 earnings data points shows that there have been 10 positive and 10 negative one-day (1D) returns, indicating a balanced outcome with positive returns occurring roughly 50% of the time.
- This percentage holds steady at 50% when the timeframe is narrowed to the last three years.
- The median of the positive returns stands at 3.4%, while the median of negative returns is at -4.7%.
Further data for the five-day (5D) and 21-day (21D) returns following earnings are compiled in the table below.
Analyzing Return Correlation After Earnings
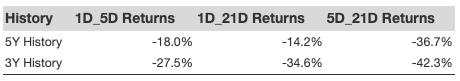
A strategic approach to managing investment risk is understanding the correlation between short-term and medium-term returns after earnings releases. Identifying pairs with the highest correlation allows traders to optimize their positions effectively. For instance, if 1D and 5D returns show strong correlation, a positive 1D return could signal a good opportunity to go long for the next five days. Below, we provide correlation data based on both five-year and three-year historical performance. Note that correlation 1D_5D shows the relationship between 1D post-earnings returns and subsequent 5D returns.
For investors interested in a strategy with demonstrated success, Trefis’s RV strategy has exceeded its all-cap stocks benchmark, composed of the S&P 500, S&P mid-cap, and Russell 2000 indices, delivering substantial returns. Additionally, for those seeking a smoother investment experience compared to individual stocks like Comcast, the High-Quality portfolio remains a compelling choice, achieving over 91% returns since its inception.
Invest with Trefis Market-Beating Portfolios
See all Trefis Price Estimates
The views and opinions expressed herein represent those of the author and do not necessarily reflect the opinions of Nasdaq, Inc.