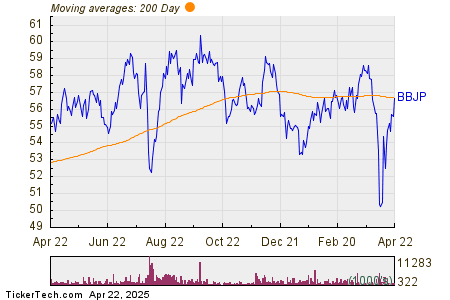
BBJP ETF Surpasses 200-Day Moving Average, Trading Gains Noted
In trading on Tuesday, shares of the BBJP ETF (Symbol: BBJP) exceeded their 200-day moving average, closing at $56.76. During the day, the shares reached a high of $57.03, marking an increase of approximately 1.9%.
The chart below illustrates the performance of BBJP shares over the past year, highlighting its relationship with the 200-day moving average:

According to the chart, BBJP’s 52-week low stands at $49.03 per share, while the 52-week high is recorded at $60.645. The most recent trade price is $56.71, situating it comfortably within the yearly range.
Free report: Top 8%+ Dividends (paid monthly)
![]()
![]()
Click here to find out which 9 other ETFs recently crossed above their 200-day moving average »
Also see:
- My Morning Joe Stock Watch
- Top Ten Hedge Funds Holding OWW
- Top Ten Hedge Funds Holding INDO
The views and opinions expressed herein are the views and opinions of the author and do not necessarily reflect those of Nasdaq, Inc.