Intel Expected to Just Break Even in Upcoming Earnings Report
Intel (NASDAQ: INTC) is scheduled to report its earnings on Thursday, April 24, 2025. Analysts predict that the technology company will see marginal results this quarter, with an expected earnings per share (EPS) of $0, compared to adjusted earnings of about $0.18 per share during the same period last year. Revenue is anticipated to drop approximately 3% to $12.31 billion. Meanwhile, Intel has been facing significant challenges in its CPU segment due to continued losses in market share in both the server and client computing domains, along with sluggish growth in the broader market. Additionally, the market’s shift from traditional CPUs to GPUs, particularly in the context of artificial intelligence, has also impacted Intel’s performance adversely.
With a current market capitalization of $82 billion, Intel’s revenue over the past twelve months stands at $53 billion. The company has reported operational losses of $4.7 billion and a net loss of $19 billion. For investors seeking a strategy with lower volatility than individual stocks, the Trefis High-Quality portfolio represents a worthwhile alternative, having outperformed the S&P 500 with returns exceeding 91% since its inception.
See earnings reaction history of all stocks
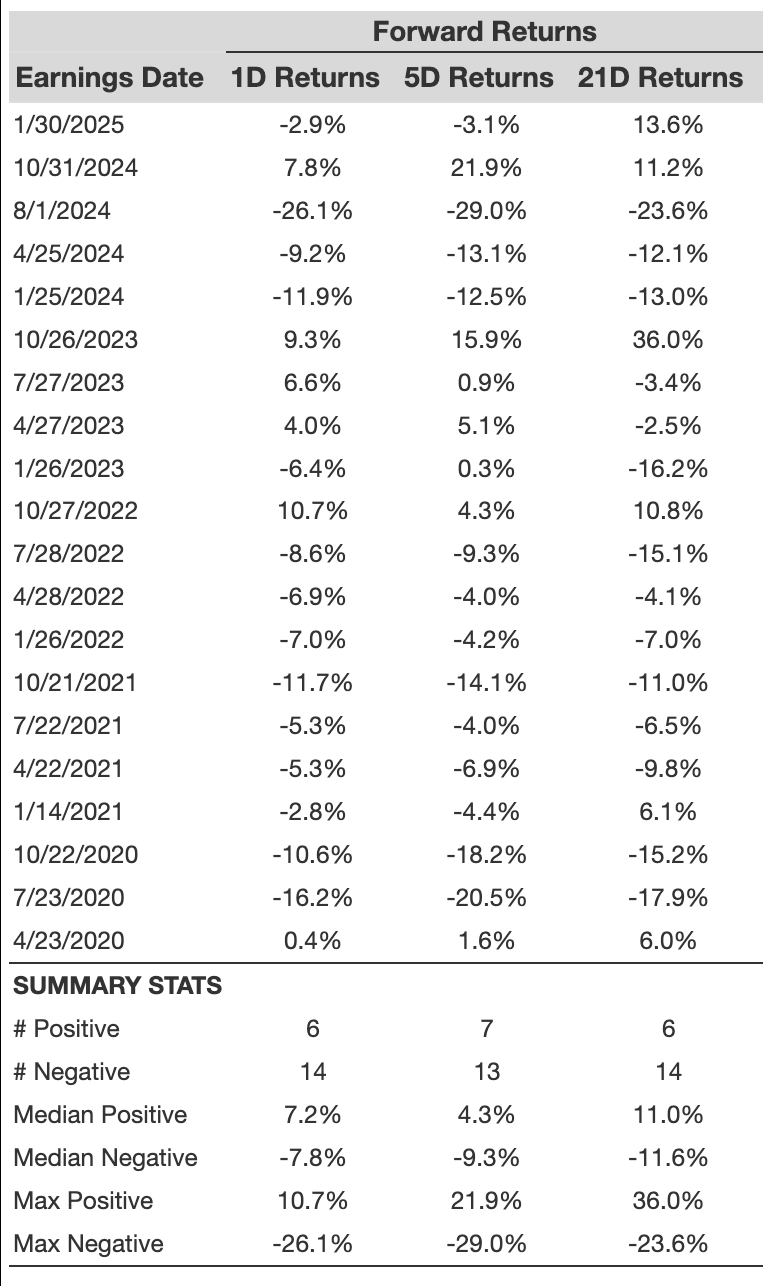
Intel’s Historical Odds of Positive Post-Earnings Return
Analyzing Intel’s one-day (1D) post-earnings returns reveals the following:
- Over the last five years, there have been 20 earnings data points, with 6 positive and 14 negative one-day returns. This results in positive post-earnings returns occurring about 30% of the time.
- This percentage improves to 42% when examining the last three years instead of five.
- The median of the 6 positive returns stands at 7.2%, while the median for the 14 negative returns is -7.8%.
For a more comprehensive overview, additional data regarding 5-day (5D) and 21-day (21D) returns after earnings announcements is summarized in the table below.

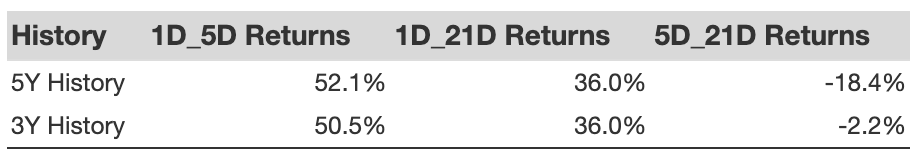
Correlation Analysis of 1D, 5D, and 21D Historical Returns
Traders looking for a less risky strategy can analyze the correlation between short-term (1D) and medium-term (5D) returns after earnings. Identifying the highest correlation allows for strategic positioning. For example, if there’s a positive 1D post-earnings return, a trader might consider taking a “long” position for the following five days if 1D and 5D returns are highly correlated. The correlation data for both five-year and three-year histories is provided below, indicating the relationship between 1D post-earnings and subsequent 5D returns.
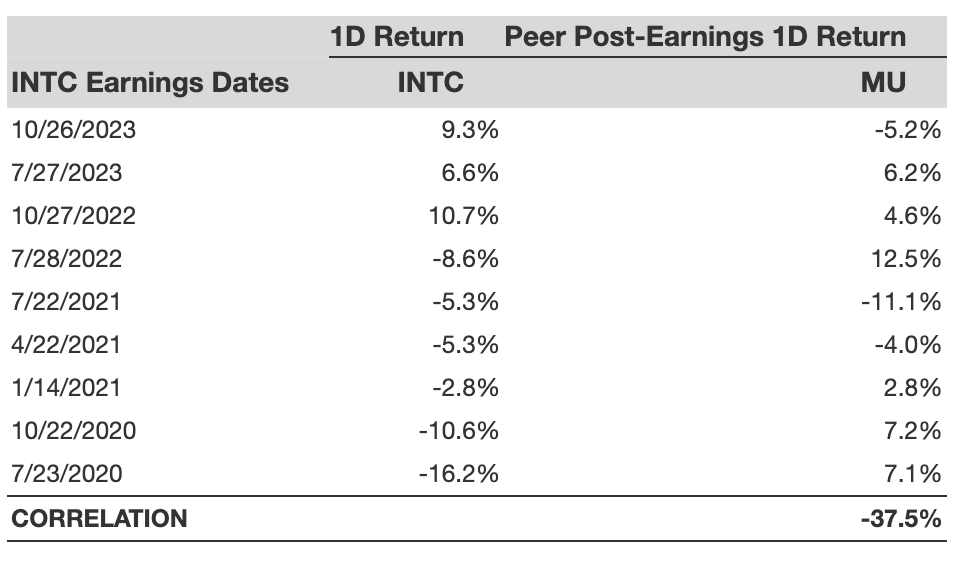
Impact of Peer Earnings on Intel’s Stock Reaction
Performance of peer companies can also influence Intel’s post-earnings stock reaction. Prior market behaviors may already factor in potential earnings outcomes before announcements occur. Below is historical data comparing Intel’s post-earnings stock performance against peers that reported their earnings just prior to Intel’s release.
For investors seeking consistency, consider the Trefis RV strategy, which has outperformed its all-cap stocks benchmark (a combination of the S&P 500, S&P medium-cap, and Russell 2000), delivering strong returns.
Invest strategically with Trefis through Market Beating Portfolios that provide diversified exposure beyond individual stocks.
See all Trefis Stock-to-reach-60-EndLinks”>Price Estimates
The views and opinions expressed herein are those of the author and do not necessarily reflect those of Nasdaq, Inc.