Key Market Signals for Savvy Investors Amid Volatility
Savvy investors recognize that successful investing hinges on identifying an edge, leveraging that edge across numerous trades, and managing risk effectively when the edge turns against them. Simply put, the most successful investors are also adept risk managers.
Today, we will explore two market bottom signals that have demonstrated perfect track records. It’s vital to remember that past performance does not guarantee future results, with each market presenting unique characteristics. However, both indicators have sizable data sets and strong historical results, warranting further consideration.
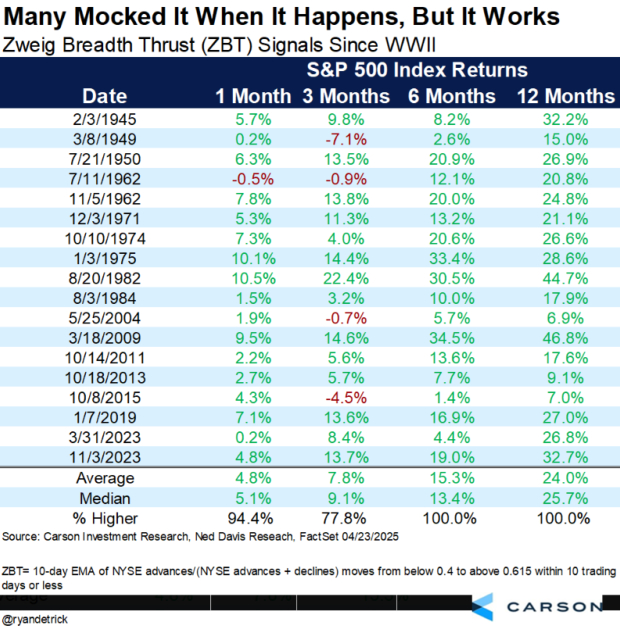
Zweig Breadth Thrust Indicator: An Unmatched Record
The Zweig Breadth Thrust Indicator is a critical tool that can offer investors a competitive advantage. How advantageous, you ask? Since World War II, this indicator has triggered only 18 times. Following each successful trigger, the S&P 500 Index has never shown lower returns six months or a year later!

Image Source: Carson Investment Research, Ned Davis Research, @ryandetrick
Defining the Zweig Breadth Thrust
The Zweig Breadth Thrust, created by renowned investor Marty Zweig, assesses a sudden increase in market breadth (the number of advancing stocks) after a decline. The calculation follows a specific formula:

Image Source: Zacks Investment Research
Consider the ZBT akin to an adrenaline boost for bullish market sentiment. Despite its brief initial impact, historical data confirms its significance in identifying major market bottoms.
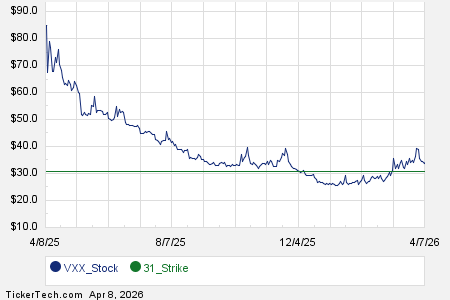
Market Bottoms and Extreme VIX Spikes Above 50
“Short-term volatility is greatest at turning points and diminishes as a trend becomes established.” ~ George Soros
The Volatility Index, or VIX, gauges Wall Street’s anticipation of short-term volatility concerning the S&P 500, derived from the pricing of S&P 500 Index options. Put simply, the VIX measures investor anxiety. When a potential crisis looms, hedge funds and institutional investors flock to the VIX.
Data from 1990 reveals that when the VIX exceeds 50 (the top 1% of historical readings), the S&P 500 Index has consistently improved over the following 1, 2, 3, 4, and 5 years (75 recorded instances). Beyond a flawless historical track record, stocks frequently achieve above-average returns post these spikes.

Image Source: TradingView
Identifying “First Mover” Stocks
Investors should focus on stocks that demonstrated resilience during market downturns, as these stocks are likely to lead the way once the market stabilizes. Notable examples include Netflix (NFLX), Uber Technologies (UBER), IonQ (IONQ), Oklo (OKLO), and Carvana (CVNA).
Bottom Line
While no indicator can ensure future market performance, the historical reliability of the Zweig Breadth Thrust and extreme VIX spikes above 50 present powerful insights for knowledgeable investors to contemplate.
The views and opinions expressed herein are the views and opinions of the author and do not necessarily reflect those of Nasdaq, Inc.