Apple Prepares for Q2 FY’25 Earnings Amid Trade Tensions
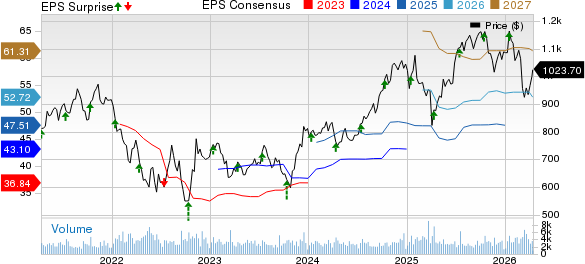
Apple (NASDAQ:AAPL) is expected to report its Q2 FY’25 results in early May. Analysts anticipate a slight increase in earnings, projecting approximately $1.61 per share, up from $1.53 per share in the same quarter last year. This growth is primarily fueled by rising services revenue and ongoing share repurchase programs.
Focus on Trade Policy Impacts
Investor attention will be closely focused on Apple’s forward-looking statements, especially in light of heightened trade tensions under the Trump Administration. Current U.S. tariffs on some Chinese imports have surged to roughly 245%. However, electronics such as smartphones and laptops remain exempt—for now. Given that Apple is estimated to manufacture 90% of its iPhones in China, any potential tariffs could significantly impact its operations. Analysts predict that, in a worst-case scenario, Apple’s earnings might drop by as much as 30% due to these tariffs.
Market Performance Overview
Apple currently boasts a market capitalization of $2.9 trillion, with revenues hitting $396 billion over the past twelve months. The company reported $126 billion in operating profits and a net income of $96 billion. For those seeking less volatility than individual stocks, the Trefis High-Quality portfolio may offer an attractive alternative, having outperformed the S&P 500 and generated returns exceeding 91% since its inception.
Apple’s Earnings Reaction History
Historical Performance Post-Earnings
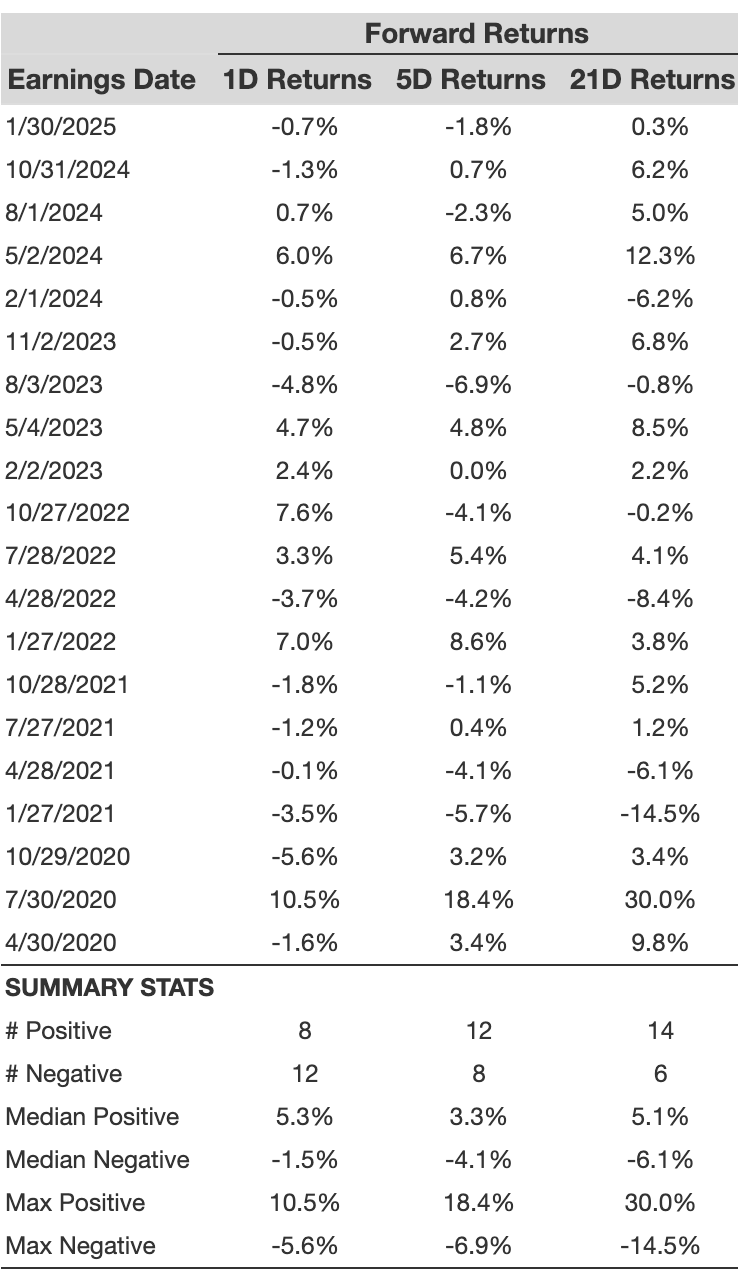
Examining Apple’s one-day (1D) post-earnings returns reveals:
- From the last five years, Apple has recorded 20 earnings points, with 8 positive and 12 negative one-day returns, equating to a 40% success rate for positive returns.
- This percentage rises to 50% when focusing on the past three years.
- The median of positive returns stands at 5.3%, while the median of negative returns is -1.5%.
Post-Earnings Return Analysis
Additional insights regarding observed 5-day (5D) and 21-day (21D) returns following earnings are detailed in the table below.
Understanding Correlation of Returns
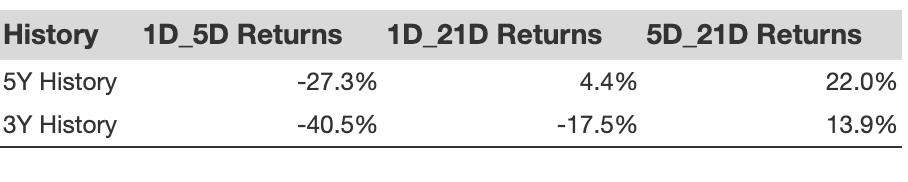
Executing trades based on the correlation between short-term and medium-term returns post-earnings is a strategy worth considering. By identifying pairs with the highest correlation, investors can position themselves effectively. For instance, if the 1D and 5D returns show a strong correlation, an investor might assume a long position for the subsequent five days following a positive 1D post-earnings result. The correlation data based on both a 5-year and a 3-year history is summarized below.
Note: The opinions expressed in this article represent the author’s views and do not reflect those of Nasdaq, Inc.