“`html
DexCom Earnings Report Expected: Historical Volatility Insights
DexCom (NASDAQ:DXCM) will release its earnings report on Thursday, May 1, 2025. Historically, the stock has seen significant volatility around its earnings announcements. Over the last five years, DXCM recorded a negative one-day return in 61% of instances, with a median negative return of -8.2% and a maximum negative return of -40.7%. This historical trend indicates considerable price fluctuations during earnings periods.
For event-driven traders, these historical patterns offer potential strategies. One approach involves analyzing past probabilities to establish positions prior to the earnings release. Another strategy focuses on evaluating the correlation between immediate and medium-term returns after the announcement to inform future trading positions.
Current Earnings Projections
Current consensus estimates suggest earnings per share of $0.33 on revenue of $1.02 billion, compared to last year’s first quarter figures which reported $0.32 EPS on $921 million in sales.
Company Fundamentals
DexCom currently exhibits a market capitalization of $28 billion, with trailing twelve-month revenue of $4.0 billion, operating profits at $600 million, and net income of $576 million.
Analyzing Historical Return Patterns
Examining the odds of positive returns following earnings announcements reveals several key insights:
- Over the past five years, there have been 18 earnings data points, yielding 7 positive and 11 negative one-day returns. Thus, positive 1D returns occurred approximately 39% of the time.
- This percentage increases to 45% when considering data from the last three years instead of five.
- The median of the 7 positive returns stands at 9.3%, while the median of the 11 negative returns is -5.0%.
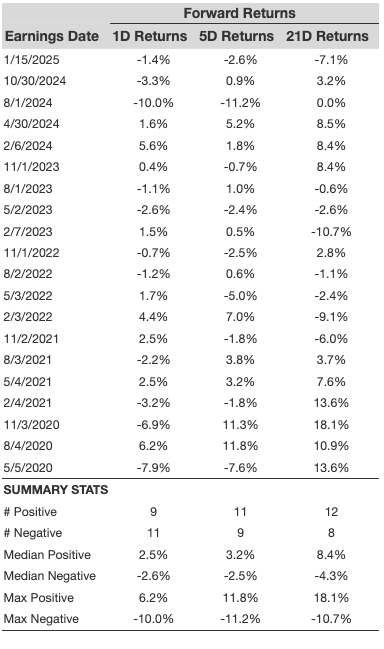
Additional data concerning 5-day (5D) and 21-day (21D) returns post earnings is summarized in the table below.
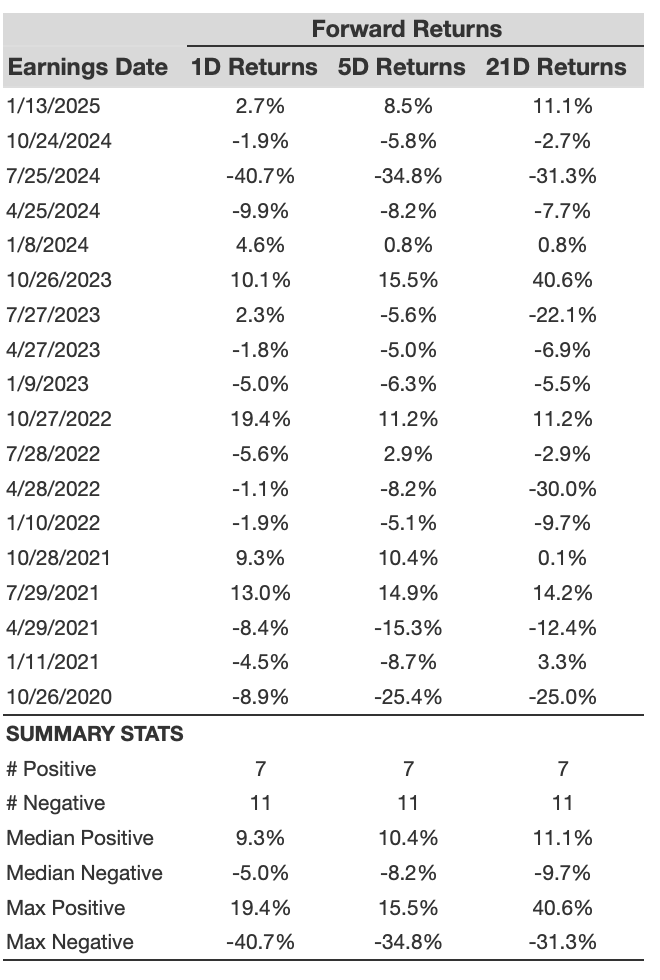
DXCM 1D, 5D, and 21D Post earnings Return
Correlation Between Historical Returns
A useful strategy may involve understanding the correlation between short-term and medium-term returns post earnings. Identifying pairs with the highest correlation enables traders to position themselves effectively. For instance, if 1D and 5D returns show high correlation, traders can opt for long positions after a positive 1D post-earnings result. The correlation data reflects both 5-year and more recent 3-year histories.
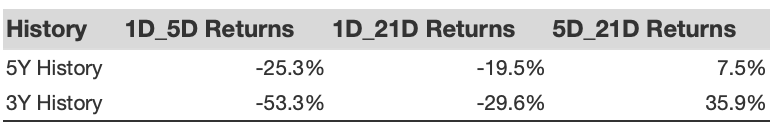
DXCM Correlation Between 1D, 5D, and 21D Historical Returns
Impact of Peer Performance
Peer stock performance can also influence a company’s post-earnings reaction. Often, pricing adjustments begin before official announcements. The following data illustrates the historical post-earnings performance of DexCom stock in comparison to peers that reported earnings immediately prior.
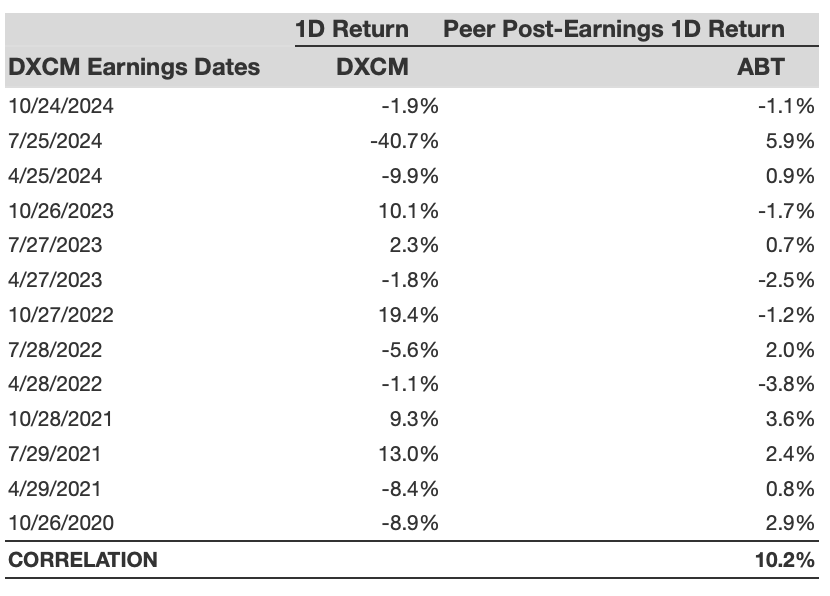
DXCM Correlation With Peer earnings
The views and opinions expressed herein are the views and opinions of the author and do not necessarily reflect those of Nasdaq, Inc.
“`