MGM Resorts Set to Report Q1 Earnings Amidst Decline
MGM Resorts Stock (NYSE: MGM) is set to report its fiscal first-quarter earnings on Wednesday, April 30, 2025. Analysts forecast earnings of $0.46 per share on $4.28 billion in revenue. This marks a year-over-year decline of 31% in earnings and a 2% decrease in revenue, compared to last year’s figures of $0.67 per share and $4.38 billion for the same quarter. Historically, the stock has declined 68% of the time following earnings announcements, with a median one-day drop of 3.4% and a maximum decline of 13%.
Focus on Long-Term Growth Despite Challenges
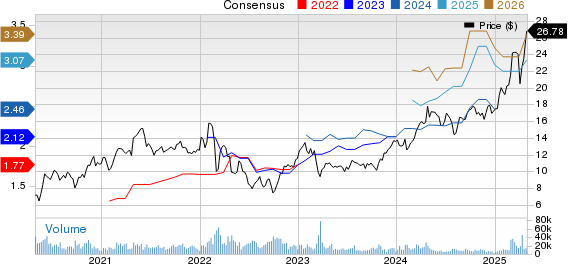
Amidst near-term headwinds such as macroeconomic pressures and tariff concerns, MGM is concentrating on long-term growth strategies. The company is emphasizing organic expansion in sports and entertainment, supported by refined pricing strategies and disciplined cost control. Currently, MGM boasts a market capitalization of $9.1 billion, with $17 billion in revenue over the past twelve months. The company reported $1.5 billion in operating profit and $747 million in net income. Event-driven traders may want to note the historical trends, as they can provide valuable insights ahead of the earnings release.
Strategies for Earnings Positioning
Traders have two main approaches to consider: they can understand the historical odds and position themselves before the earnings announcement, or they can examine the correlation between immediate and medium-term returns post-earnings to determine their strategy afterward. For those seeking lower volatility investments, the Trefis High Quality portfolio serves as an alternative, having outperformed the S&P 500 with returns exceeding 91% since its inception.

Image by stokpic from Pixabay
MGM Resorts’ Historical Odds of Positive Post-Earnings Return
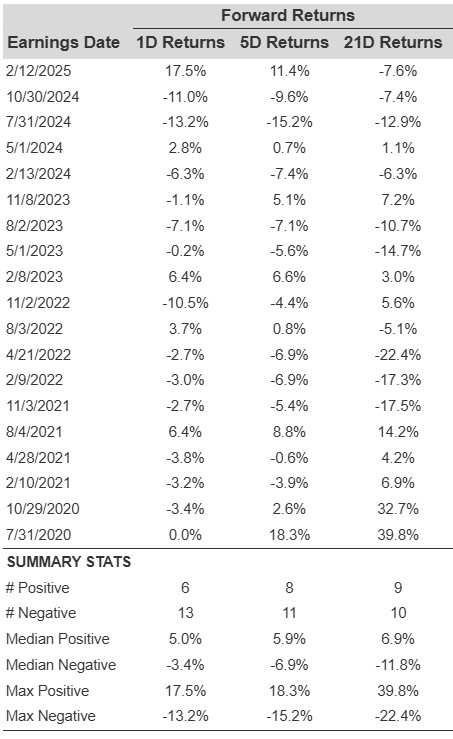
Analyzing one-day (1D) post-earnings returns reveals some noteworthy statistics:
- Over the last five years, there have been 19 recorded earnings data points, with 6 positive and 13 negative one-day returns. This shows that positive returns occurred about 32% of the time.
- This percentage improves to 36% when analyzing the last 3 years.
- The median of the 6 positive returns is 5.0%, while the median of the 13 negative returns stands at -3.4%.
Information regarding observed 5-Day (5D) and 21-Day (21D) returns post-earnings can be found in the table below.
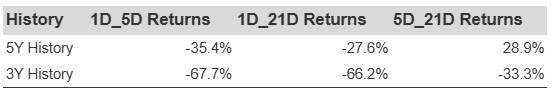
Correlation Between 1D, 5D, and 21D Historical Returns
Understanding the correlation between short-term and medium-term returns post-earnings can help traders reduce risk. Finding a pair with the highest correlation allows for strategic positioning. For instance, if a positive 1D return follows an earnings release, a trader might choose to maintain a “long” position for the subsequent 5 days. The correlation between 1D and 5D returns can be explored using both 5-year and 3-year historical data.
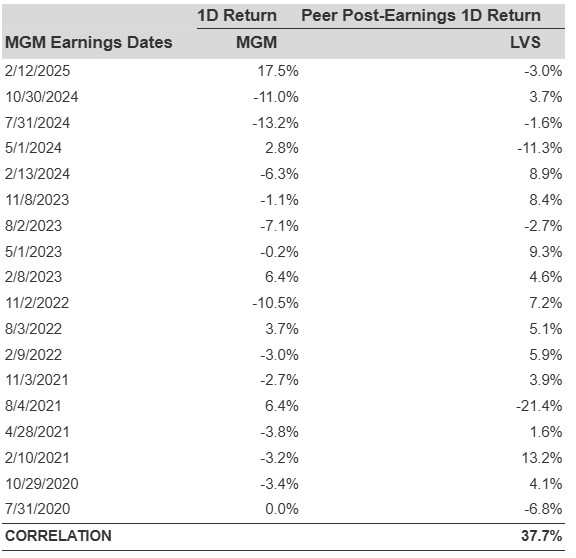
Correlation with Peer Earnings
Peer performance can sometimes impact the post-earnings stock reaction of MGM Resorts. In some cases, market pricing might begin before the earnings are officially announced. Historical data compares the post-earnings performance of MGM Resorts to that of its peers reporting earnings shortly before MGM. For fairness, peer Stock returns are also depicted as post-earnings one-day returns.
The views and opinions expressed herein are the views and opinions of the author and do not necessarily reflect those of Nasdaq, Inc.