
Estée Lauder Earnings: Key Insights Ahead of Release on May 1
Estée Lauder Companies (NYSE:EL) is set to report its earnings on Thursday, May 1, 2025. Historical patterns may provide event-driven traders with valuable insights for developing potential trading strategies. Over the past five years, Estée Lauder’s stock has seen negative one-day returns after earnings announcements in 70% of the cases. The median negative return was -7.3%, with a peak drop of -20.9% recorded.
Traders can utilize these historical patterns in two primary ways. First, understanding the likelihood of negative returns can help them position themselves strategically before the earnings release. Second, analyzing the relationship between immediate post-earnings returns and medium-term performance can aid in making informed trading decisions after the announcement.
Expectations for Upcoming Earnings Report
The upcoming earnings report is expected to reveal a decline compared to the same quarter last year. Consensus estimates forecast earnings per share of $0.31 on revenues of $3.51 billion, a decrease from $0.97 per share and $3.94 billion a year earlier. This drop is primarily linked to weaker demand in mainland China and challenges within the global travel retail sector, both poised to adversely affect Estée Lauder’s Q3 results.
From a fundamental standpoint, Estée Lauder currently holds a market capitalization of $21 billion. Over the last year, the company generated $15 billion in revenue but faced a net loss of $700 million.
Market Reaction and Historical Context
The actual market response to Estée Lauder’s upcoming earnings will rely heavily on how the results compare to existing expectations. By understanding the historical post-earnings stock behavior and today’s fundamental challenges, traders can gain essential context for their strategies.
Historical Odds of Positive Post-Earnings Returns
Analyzing one-day (1D) post-earnings returns reveals significant insights:
- Across 20 earnings data points from the last five years, there were 6 positive and 14 negative one-day returns, indicating positive returns occurred about 30% of the time.
- This percentage drops to 17% when reviewing only the last three years.
- The median of the 6 positive returns is 3.4%, while the median for the 14 negative returns is -7.3%.
Further details on observed 5-Day (5D) and 21-Day (21D) returns post-earnings are presented in the accompanying table.
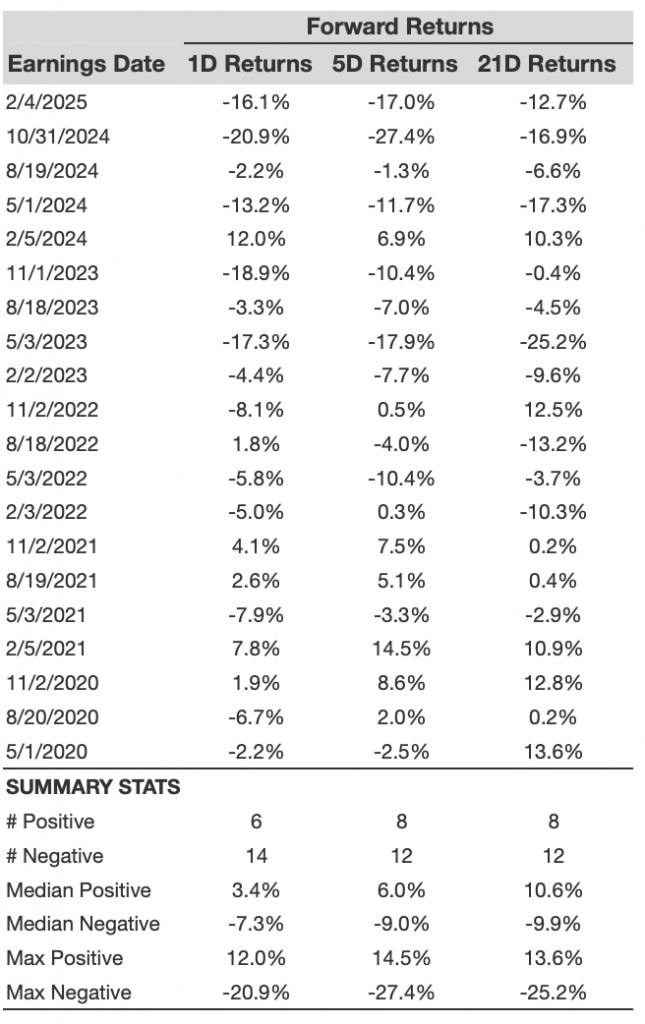
EL 1D, 5D, and 21D Post-earnings Return
Analyzing Correlation Between Historical Returns
A useful trading strategy focuses on understanding the correlation between short-term and medium-term returns post-earnings. Identifying the pair with the strongest correlation allows traders to make informed decisions. For instance, if 1D and 5D returns are highly correlated, traders may choose to go “long” if the 1D post-earnings return is positive. Correlation data spanning five and three years can provide crucial insights for these trades.
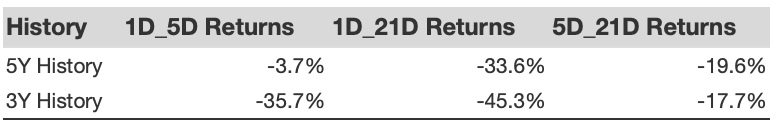
EL Correlation Between 1D, 5D and 21D Historical Returns
Impact of Peers on Estée Lauder’s Performance
The performance of competing companies can influence the market reaction to Estée Lauder’s post-earnings stock movement. Often, anticipatory trading may occur prior to the announcement. Historical data comparing Estée Lauder’s post-earnings stock performance with that of its peers provides additional context for trading decisions.
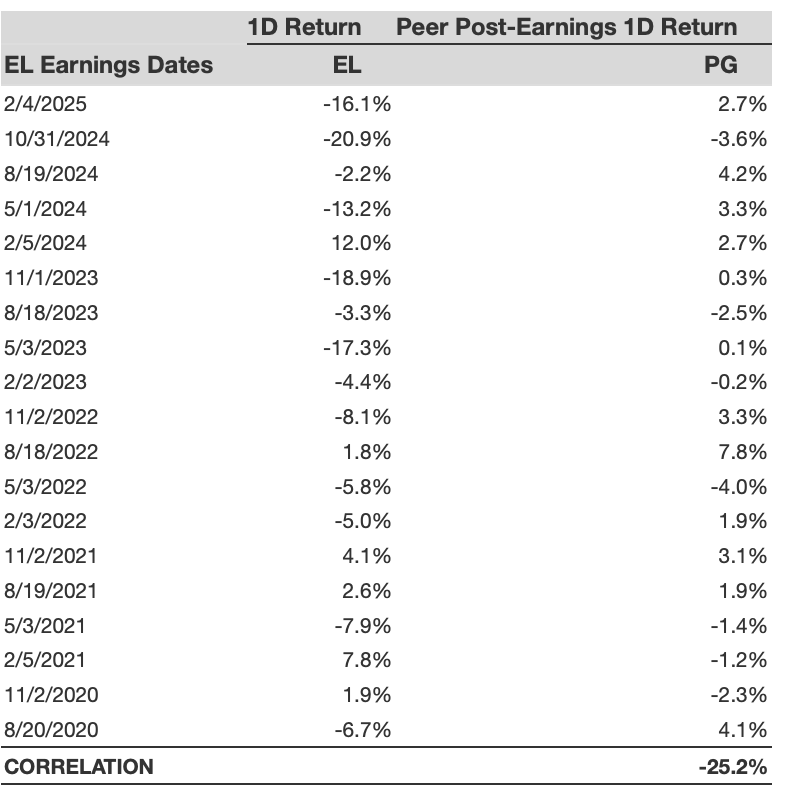
EL Correlation With Peer earnings
The insights provided in this article can help investors navigate potential strategies. Understanding the nuances of Estée Lauder’s historical performance and market dynamics could enhance trading success.
The views and opinions expressed herein are those of the author and do not necessarily reflect official positions.