Bristol Myers Squibb Reports Decline in Q1 Revenue but Raises 2025 Outlook
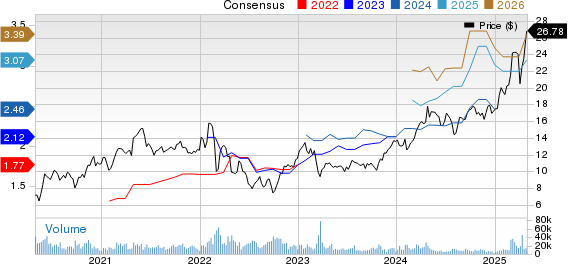
Bristol Myers Squibb (NYSE:BMY) released its first-quarter earnings, reporting adjusted earnings of $1.80 per share on revenue of $11.2 billion. This revenue reflects a 6% decline year-over-year compared to the previous quarter’s $11.9 billion and the prior year’s loss of $4.40 per share.
Despite a decrease in revenue, BMY has raised its revenue and profit guidance for the full year due to successful cost-reduction initiatives. The company now expects 2025 revenue to be between $45.8 billion and $46.8 billion, an increase from its earlier estimate of about $45.5 billion. Additionally, full-year adjusted earnings per share are projected to be between $6.70 and $7.00, up from the previous range of $6.55 to $6.85 per share. This updated guidance accounts for new tariffs affecting products shipped to China.
With these better-than-expected first-quarter results and an improved financial outlook, investors are considering whether BMY’s stock, now trading around $48, is a buying opportunity. Our analysis indicates it may be. BMY appears to be a strong investment at its current valuation, suggesting it could be a favorable stock to acquire. This conclusion is based on a comparison of the company’s current valuation with its recent financial performance and overall financial health. A review of Bristol Myers Squibb through key metrics—growth, profitability, financial stability, and downturn resilience—shows moderate performance and a stable financial condition, as detailed below.
For those seeking lower volatility than individual stocks, the Trefis High Quality portfolio may be a suitable alternative, outperforming the S&P 500 and delivering over 91% in returns since its launch.
Valuation of Bristol-Myers Squibb Compared to the S&P 500
In terms of sales and profit, BMY stock appears undervalued compared to the broader market.
- Bristol-Myers Squibb holds a price-to-sales (P/S) ratio of 2.0, while the S&P 500’s figure is 2.8.
- The company’s price-to-free cash flow (P/FCF) ratio stands at 6.5, compared to a ratio of 17.6 for the S&P 500.
- BMY’s current price-to-earnings (P/E) ratio is 6.5, significantly lower than its long-term average P/E multiple of about 10.
Revenue Growth for Bristol-Myers Squibb in Recent Years
Bristol-Myers Squibb has experienced mixed revenue growth over the past few years.
- The company’s revenue has grown at an average annual rate of 1.4% over the last three years, compared to a 6.2% increase for the S&P 500.
- Recently, its revenues increased by 7.3%, rising from $45 billion to $48 billion within the last 12 months, outpacing the S&P 500’s growth of 5.3%.
- However, quarterly revenues declined by 6%, from $11.9 billion last year to $11.2 billion this quarter, while the S&P 500 saw a 4.9% improvement.
Profitability Metrics for Bristol-Myers Squibb
The profit margins for Bristol-Myers Squibb remain robust.
- The company’s operating income over the last four quarters was $7.9 billion, yielding an operating margin of 16.5%, compared to the S&P 500’s 13.1%.
- Operating cash flow (OCF) during this period totaled $14 billion, resulting in a high OCF margin of 30%, in contrast to 15.7% for the S&P 500.
- For the same four-quarter period, Bristol-Myers Squibb’s net income was $5.4 billion, reflecting a net income margin of 11.4%, nearly identical to the S&P 500’s 11.3%.
Financial Stability of Bristol-Myers Squibb
The balance sheet of Bristol-Myers Squibb shows reasonable stability.
- The company reported total debt of $51 billion as of the last quarter, while its market capitalization stands at $97 billion as of April 25, 2025. This translates to a debt-to-equity ratio of 51.8%, compared to the S&P 500’s 21.5%. [Note: A lower debt-to-equity ratio is preferred]
- Cash and cash equivalents total $11 billion, making up approximately 11.7% of the company’s total assets of $93 billion, compared to 15.0% for the S&P 500.
BMY Stock Resilience During Market Downturns
BMY stock has shown resilience but has underperformed compared to the S&P 500 during recent downturns. Those concerned about market dips affecting BMY can refer to our dashboard, which highlights how the stock reacted in previous market crashes.
Impact of Inflation Shock (2022)
- BMY stock experienced a 40.2% decline from its peak of $81.13 on December 2, 2022, to $48.48 on November 21, 2023, versus a peak-to-trough decline of 25.4% for the S&P 500.
- The stock has yet to recover to its pre-crisis high.
- The highest price reached since then was $63.11 on March 10, 2025, while it currently trades near $48.
COVID-19 Pandemic (2020)
- BMY stock declined by 31.2%, falling from $67.43 on January 21, 2020, to $46.40 on March 23, 2020, compared to a peak-to-trough decline of 33.9% for the S&P 500.
- The stock fully recovered to its pre-crisis high by July 12, 2021.
Global Financial Crisis (2008)
- BMY stock dropped 46.3% from a high of $32.14 on July 17, 2007, to $17.26 on October 16, 2008, in contrast to a peak-to-trough decline of 56.8% for the S&P 500.
- The stock returned to its pre-crisis high by October 5, 2011.
Conclusion: Outlook for BMY Stock
To summarize, Bristol-Myers Squibb’s performance across key metrics is as follows:
- Growth: Strong
- Profitability: Strong
- Financial Stability: Neutral
- Downturn Resilience: Neutral
- Overall: Good
Given BMY’s solid performance and low valuation, the stock seems like a promising investment. The company’s better-than-expected first-quarter results and raised financial guidance should further enhance investor confidence.
While BMY stock appears attractive, investing in individual companies can carry risks. Conversely, the Trefis High Quality (HQ) Portfolio, composed of 30 carefully selected stocks, has consistently outperformed the S&P 500 in the past four years.
The views and opinions expressed herein are those of the author and do not necessarily reflect those of Nasdaq, Inc.