“`html
Intercontinental Exchange Prepares for Strong Earnings Report
Intercontinental Exchange (NYSE:ICE) is set to announce its earnings on Thursday, May 1, 2025. Analysts forecast a revenue increase of approximately 10% year-over-year, reaching $1.23 billion. Earnings are projected to be around $0.77 per share, which is an increase of about $0.14 from the previous year. Key trends contributing to this performance include record activity in futures and options, as well as rising trading volumes in energy and interest rates. The volatility in the markets is expected to keep these trends strong in Q1. In its Q4 earnings released in January, ICE reported a 21% year-over-year increase in January trading volumes and an 11% rise in open interest, indicating ongoing momentum in its futures and options business.
The company’s market capitalization currently stands at $94 billion. Over the past twelve months, it has generated revenue of $12 billion, with operational profits amounting to $4.4 billion and net income at $2.8 billion. For investors seeking lower volatility than individual stocks, the Trefis High Quality portfolio serves as an alternative investment, having outperformed the S&P 500 with returns exceeding 91% since its inception.
Intercontinental Exchange’s Historical Odds Of Positive Post-Earnings Return
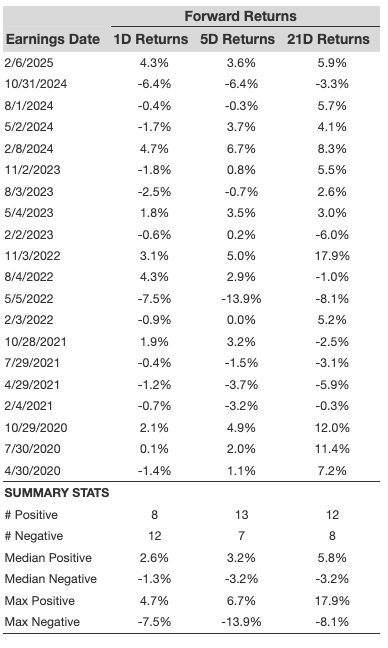
Observations on one-day (1D) post-earnings returns reveal the following:
- Out of 20 recorded earnings data points over the last five years, there were 8 positive and 12 negative one-day (1D) returns, resulting in positive returns approximately 40% of the time.
- This percentage improves to 42% when considering the last three years instead of five.
- The median of the 8 positive returns is 2.6%, while the median of the 12 negative returns stands at -1.3%.
Additional 5-Day (5D) and 21-Day (21D) returns following earnings are included in the table below.
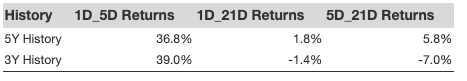
Correlation Between 1D, 5D, and 21D Historical Returns
Understanding the correlation between short-term and medium-term returns post-earnings can be beneficial, especially if the correlation is strong. For instance, if 1D and 5D show a high correlation, traders might consider positioning “long” for the next five days following a positive 1D post-earnings return. Below is correlation data based on both 5-year and 3-year histories. The correlation 1D_5D indicates the relationship between 1D post-earnings returns and subsequent 5D returns.
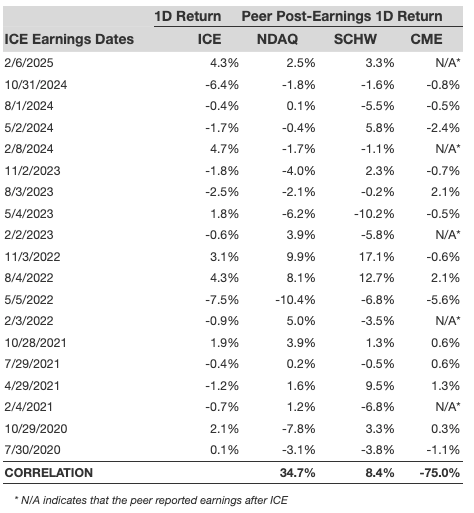
Is There Any Correlation With Peer Earnings?
Performance of peers can also impact post-earnings stock reactions. Anticipation of earnings may begin before the official announcement. The data below compares the post-earnings performance of Intercontinental Exchange with that of peers reporting earnings just prior. This comparison is based on one-day (1D) returns.
The views and opinions expressed herein are those of the author and do not necessarily reflect those of Nasdaq, Inc.
“`