Q1 Earnings Review: Tech Giants Show Mixed Results
The market reacted positively to results from Microsoft (MSFT) and Meta Platforms (META), had a mixed view on parts of Amazon’s (AMZN) report, and responded negatively to Apple’s (AAPL) numbers. With these earnings releases, we now have Q1 performance from six members of the ‘Magnificent 7’ group.
Aggregate Growth Metrics Among the Magnificent 7
The aggregate growth figures are noteworthy, but there is significant variation among the Magnificent 7 companies. Year-over-year earnings growth rates varied dramatically, with Tesla facing a decline of -56.8%, while Apple saw growth of +4.8%. In contrast, Amazon, and Alphabet experienced increases of +42.6% and +46%, respectively.
The following chart illustrates the blended Q1 earnings and revenue growth relative to previous periods and projected growth for the next three quarters.
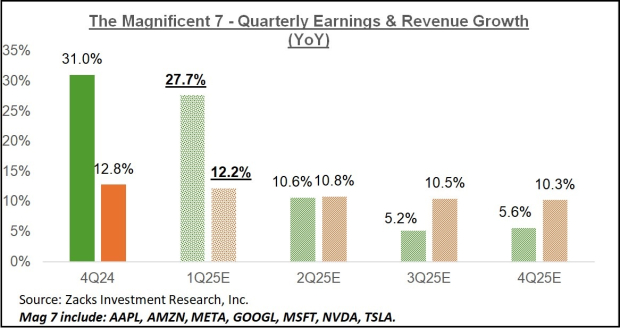
Image Source: Zacks Investment Research
Capital Expenditure Trends Amid Market Pressures
Despite recent pressures, companies are sticking to their capital expenditure plans. Continued investments in AI infrastructure remain crucial for maintaining competitive positioning. For instance, Alphabet’s Google search division appears threatened in the evolving AI landscape, prompting the company to bolster its defenses.
Amazon, a leader in the cloud computing sector, reported a slowdown in growth attributed to capacity limits in its data center assets. Amazon Web Services (AWS) revenues climbed +16.9% to $29.3 billion, slightly below consensus estimates. This growth marks a decline from +18.9% in Q4 2024 and +19.1% in Q3 2024.
The trend indicates a consistent deceleration in AWS revenue growth. This expected decline aligns with trends seen from Alphabet. However, Microsoft’s cloud performance has significantly outpaced both Amazon and Alphabet.
Many market observers had anticipated a stronger growth trajectory for Amazon’s cloud division similar to Microsoft’s. Although Amazon’s cloud results are decent, they do not reflect extraordinary performance.
Outlook for Amazon’s Q2 Earnings
Amazon’s cautiously adjusted Q2 earnings guidance is not due to tariffs but rather reflects the timing of specific operating expenses. Revenue guidance aligns with consensus expectations, indicating the resilience of Amazon’s business model, especially in retail. Approximately half of the sellers on the platform are based in China, contributing to this stability.
Apple, by contrast, faced a pronounced tariff impact, with gross margins for the June quarter declining by approximately 100 basis points. Amid the uncertainty, the company provided limited insights on its performance. For the March quarter, Apple reported earnings growth of +4.8% accompanied by a +5.1% increase in revenues.
The following chart shows the performance of Microsoft (up +5.3%), Meta (down -14.5%), Amazon (down -16%), and Apple (down -16.1%) relative to the Zacks Tech sector (down -12.3%) and the S&P 500 index (down -9.1%).
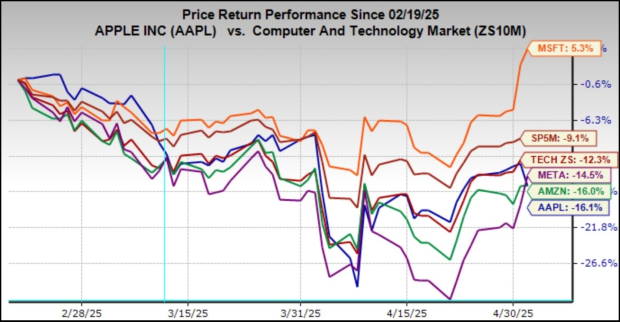
Image Source: Zacks Investment Research
China Exposure and Apple’s Strategy
Apple’s underperformance can be attributed largely to its exposure in China. While the company plans to shift iPhone assembly to India for exports, investor confidence remains cautious regarding the effectiveness of this strategy.
Additionally, Apple’s significant revenue and earnings contributions from the Chinese market complicate its position. The company faces not only competition from local firms but also scrutiny as an American brand in an environment where nationalism may deter local consumption.
The following chart demonstrates the Magnificent 7 group’s annual earnings and revenue growth trend.
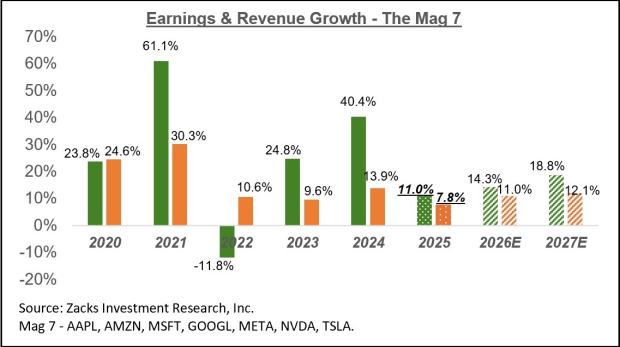
Image Source: Zacks Investment Research
Estimating Future Earnings Trends
Recent estimates for the Magnificent 7 group have begun to decline after a period of strong projections. However, the better-than-expected Q1 earnings results have temporarily reversed this downward trend. Today’s forecast shows +11% earnings growth for the year, an increase from +9.9% last week but down from +15.7% projected three months ago.
The chart below illustrates the evolution of aggregate dollar earnings for full-year 2025 over the past six to seven months.
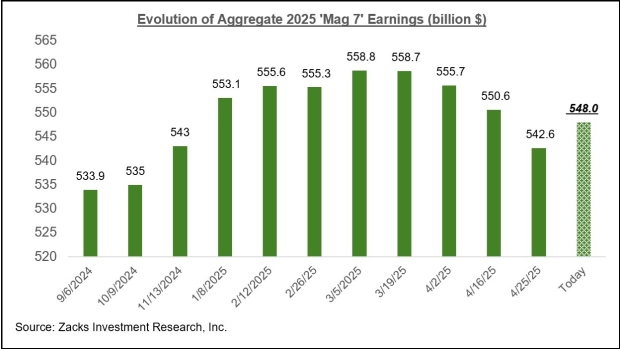
Image Source: Zacks Investment Research
The Magnificent 7 group is now projected to account for 23.9% of all S&P 500 earnings in 2025, up from 23.2% in 2024 and 18.3% in 2023. In terms of market capitalization, this group currently represents a 30.6% weight within the index. If these companies formed a standalone sector, they would rank as the second largest in the S&P 500, following the Technology sector at 38.7% and surpassing the Finance sector at 13.5%.
Upcoming Key Earnings Reports
This week, over 1,300 companies are scheduled to report earnings, including 94 S&P 500 members. Major bellwethers include Ford, Disney, Warner Bros Discovery, Uber, and DoorDash. By week’s end, Q1 results will be available for over 90% of the index’s total members.
Q1 Earnings Scorecard Overview
As of Friday, May 2nd, Q1 results from 358 S&P 500 members have been released, representing 71.6% of the index. Total earnings for these companies increased +13.4% year-over-year, alongside +4.3% revenue growth. So far, 72.6% of the reporting companies have exceeded EPS estimates, and 60.6% have surpassed revenue expectations.
“`html
Q1 Earnings Report: Key Insights on Growth and Estimates
The comparison charts below put the Q1 earnings and revenue growth rates for these index members in a historical context.
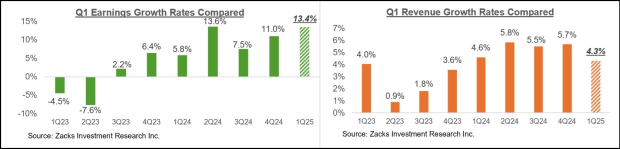
Image Source: Zacks Investment Research
The comparison charts below illustrate the Q1 EPS and revenue beats percentages within a historical framework.
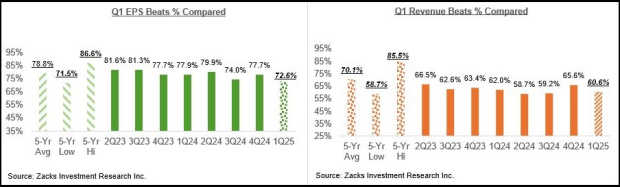
Image Source: Zacks Investment Research
Current Earnings Trends
As indicated in recent reports, the EPS and revenue beats percentages are falling below historical averages. For the companies that have reported, the Q1 EPS beats percentage is at 72.6%, lower than the 20-quarter average of 78.8%. Similarly, the revenue beats percentage is also below the 20-quarter average, but to a greater extent.
Q1 Earnings Outlook
When considering Q1 as a whole, combining data from 358 S&P 500 members with ongoing estimates, earnings are expected to increase by 11.6% year-over-year, supported by a 4.5% revenue growth; a noteworthy slowdown from the previous period’s earnings growth of 14.1% on revenue gains of 5.7%.
The chart below demonstrates current earnings and revenue growth expectations for Q1 2025 compared to previous quarters and projected fiscal performance for the next three quarters.
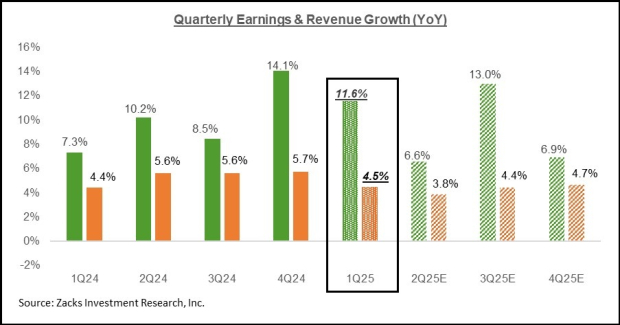
Image Source: Zacks Investment Research
Recent weeks have shown a decline in estimates for the current period (Q2 2025), and further negative revisions are anticipated as companies report their results and express concerns about their near-term outlook.
Market Influencers
The evolving tariff regime may necessitate further cuts to earnings estimates. Current market weaknesses reflect these reduced earnings expectations. The following chart indicates how these expectations have shifted since the beginning of the year.
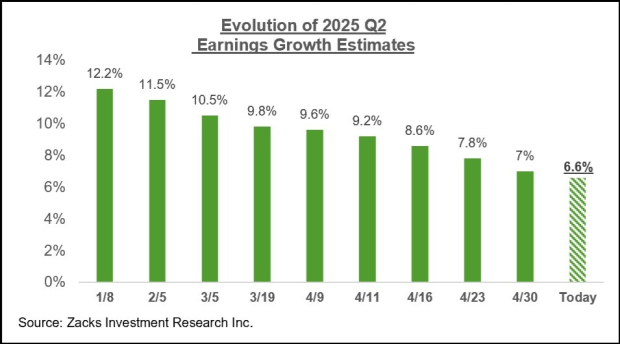
Image Source: Zacks Investment Research
Additionally, the overall earnings landscape on a calendar-year basis is presented below.
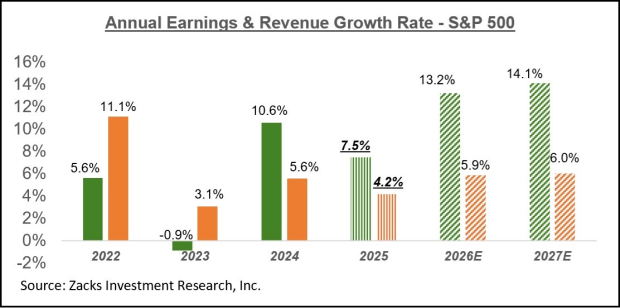
Image Source: Zacks Investment Research
Expectations for full-year 2025 have faced increasing pressures recently. A trend of negative revisions has gained significant momentum since mid-February 2025.
Sector Outlook
Revisions have affected 14 of the 16 Zacks sectors, with Aerospace and Construction being the only sectors experiencing slight positive adjustments. In contrast, the sectors with the most substantial cuts include Transportation, Energy, Autos, Basic Materials, Tech, and Finance.
The chart below tracks the evolution of full-year 2025 earnings growth expectations in recent weeks.
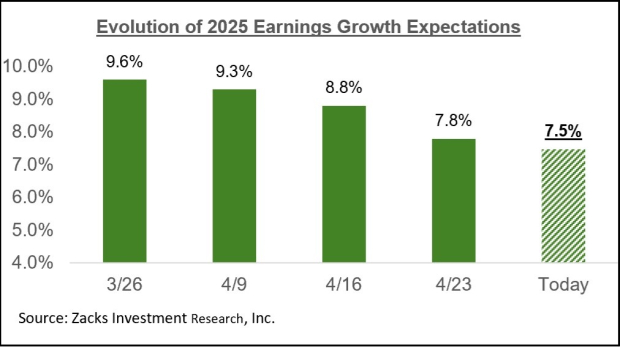
Image Source: Zacks Investment Research
For a detailed look at the evolving earnings landscape, consult our weekly earnings Trends report.
The views and opinions expressed herein are the views and opinions of the author and do not necessarily reflect those of Nasdaq, Inc.
“`