Vertex Pharmaceuticals Set to Announce Earnings on May 5, 2025
Vertex Pharmaceuticals (NASDAQ:VRTX) will release its earnings report on Monday, May 5, 2025. Event-driven traders may find it useful to examine the company’s stock performance history around earnings announcements. Over the past five years, VRTX has seen a positive one-day return after earnings announcements 58% of the time. When the returns were positive, the median was 3.0%, with a peak return of 9.0%.
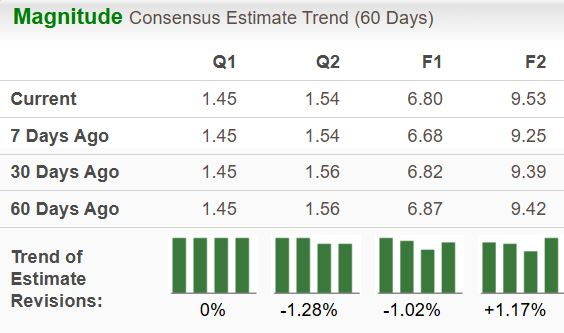
Expected Earnings and Sales Figures
The upcoming earnings report is projected to show earnings per share of $4.29 on sales of $2.86 billion, according to consensus estimates. This contrasts with the same quarter last year, where earnings were $4.76 per share and sales were $2.69 billion.
Market Reaction and Trading Strategies
The market’s reaction will depend on how the reported numbers align with these estimates and overall expectations. Historical data supports potential trading strategies. One option is to evaluate the historical likelihood of positive returns and establish positions ahead of the earnings release. Another approach involves analyzing the connection between immediate post-earnings returns and medium-term trends to guide trading decisions after the announcement.
Vertex’s Financial Overview
Currently, VRTX holds a market capitalization of $130 billion. The company reported revenue of $11 billion over the past twelve months, generating $4.4 billion in operating profits. However, it also recorded a net loss of $536 million.
Historical Performance Insights
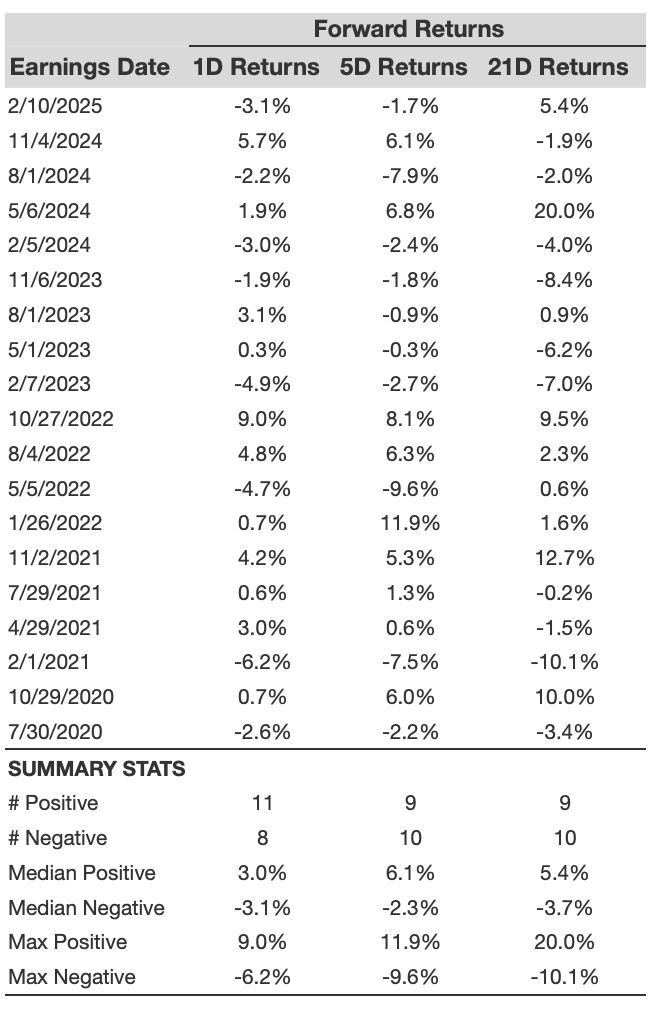
Here are some key insights into VRTX’s historical post-earnings returns:
- In the last five years, 19 earnings events have been recorded, yielding 11 positive and 8 negative one-day returns.
- Positive returns occurred approximately 58% of the time; however, this figure drops to 50% when looking at the last three years.
- The median of the 11 positive returns was 3.0%, while the median of the 8 negative returns was -3.1%.
5-Day and 21-Day Return Statistics
Additional data on 5-day (5D) and 21-day (21D) returns following earnings are summarized in the table below.
VRTX 1D, 5D, and 21D Post-Earnings Return
Understanding Correlation in Historical Returns
A strategic, lower-risk approach involves assessing the correlation between short-term and medium-term post-earnings returns. Identifying the strongest correlations can help traders position themselves effectively. For instance, if the correlation between one-day and five-day returns is high, traders might take long positions for five days if the one-day return is favorable.
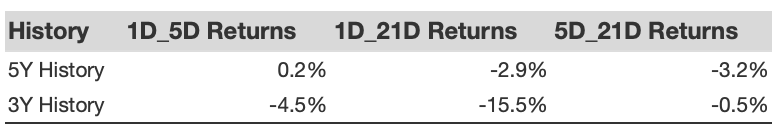
VRTX Correlation Between 1D, 5D and 21D Historical Returns
The views and opinions expressed herein are those of the author and do not necessarily reflect those of Nasdaq, Inc.