Analysts See Strong Upside for BlackRock U.S. Carbon ETF
ETF Channel’s analysis of ETF holdings reveals promising data for investors. The BlackRock U.S. Carbon Transition Readiness ETF (Symbol: LCTU) has an implied analyst target price of $71.08 per unit based on its underlying holdings.
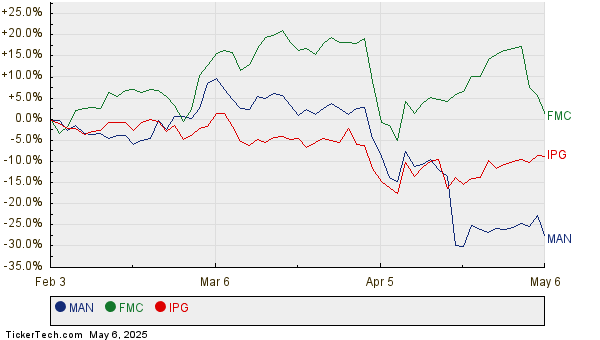
Currently, LCTU trades at approximately $61.03 per unit, suggesting a potential upside of 16.47% according to average analyst targets. Noteworthy among its holdings are ManpowerGroup Inc (Symbol: MAN), FMC Corp. (Symbol: FMC), and Interpublic Group of Companies Inc. (Symbol: IPG), each identified as having significant upside potential.
For instance, ManpowerGroup has a recent trading price of $40.77 per share, with analysts targeting an average price of $53.11, reflecting a 30.27% upside. Similarly, FMC’s current price is $35.91, with an average target of $46.00, indicating a 28.10% upside. Analysts anticipate that IPG, trading at $25.31, will reach a target price of $31.38, suggesting a 23.96% increase. The chart below illustrates the twelve-month price history for these stocks:

The current analyst target prices are summarized in the table below:
| Name | Symbol | Recent Price | Avg. Analyst 12-Mo. Target | % Upside to Target |
|---|---|---|---|---|
| BlackRock U.S. Carbon Transition Readiness ETF | LCTU | $61.03 | $71.08 | 16.47% |
| ManpowerGroup Inc | MAN | $40.77 | $53.11 | 30.27% |
| FMC Corp. | FMC | $35.91 | $46.00 | 28.10% |
| Interpublic Group of Companies Inc. | IPG | $25.31 | $31.38 | 23.96% |
Are analysts optimistic or realistic in their targets? These evaluations often depend on recent company developments and industry trends. A high price target might indicate future potential, but it could also suggest the possibility of downgrades if the targets are outdated. Investors should conduct thorough research to assess the validity of these estimates.
![]()
![]() 10 ETFs With Most Upside To Analyst Targets »
10 ETFs With Most Upside To Analyst Targets »
Also see:
• AMDA market cap history
• Top Ten Hedge Funds Holding NADL
• EGY Dividend Growth Rate
The views and opinions expressed herein are those of the author and do not necessarily reflect those of Nasdaq, Inc.
5 Stocks Our Experts Predict Could Double In the Next Year
By submitting your email, you'll also get a free pivot & flow membership. A free daily market overview. You can unsubscribe at any time.