“`html
The Williams Companies Reports Strong Earnings Amid Competitive Market
The Williams Companies, Inc. (WMB) reported adjusted earnings per share of 60 cents for the first quarter of 2025, surpassing the Zacks Consensus Estimate of 55 cents. This figure also represents an increase from the 59 cents reported in the same period last year. The company’s notable performance is attributed to the strong results from its Transmission & Gulf of America, Northeast G&P, and West segments.
Headquartered in Tulsa, OK, Williams generated revenues of $3 billion, falling short of the Zacks Consensus Estimate by $93 million. This shortfall was primarily due to weaker performance in its Gas & NGL Marketing Services segment. However, revenue improved from $2.8 billion year-over-year, driven by an increase in service revenues and product sales.
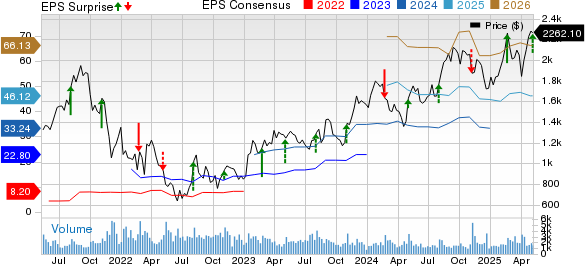
Williams Companies’ Price, Consensus, and EPS Surprise

Williams Companies, Inc. (The) price-consensus-eps-surprise-chart | Williams Companies, Inc. (The) Quote
During this quarter, Williams made substantial progress on key initiatives, including the $1.6 billion Commercialization of Socrates, aimed at meeting growing AI demand. The company announced an expansion of Transco’s Power Express project to serve the Virginia market and acquired a 10% stake in Cogentrix Energy to enhance gas supply. The Louisiana Energy Pathway and Southeast Energy Connector projects were also initiated and went into service on April 1, 2025. Additionally, construction began on the Alabama-Georgia Connector, and the Overthrust Westbound Expansion commenced in the MountainWest region, with the Whale and Ballymore projects starting operations in the Deepwater area.
Key Highlights from WMB
The company reported adjusted EBITDA of $1.9 billion during the quarter, marking a 2.8% increase from the previous year. This growth was driven by rising natural gas demand, supported by acquisitions and expansion projects.
Additionally, cash flow from operations reached $1.4 billion, reflecting a 16% increase compared to the same quarter in 2024.
Segment Performance Analysis
Transmission & Gulf of Mexico: This segment recorded adjusted EBITDA of $862 million, up from the previous year’s $839 million. The growth stemmed from positive contributions from Regional Energy Access and Southside Reliability Enhancement projects, as well as increased Gulf production. However, it fell short of the Zacks Consensus Estimate of $898 million due to rising expenses.
West: Focused on gathering and processing assets in the Western U.S., this segment achieved adjusted EBITDA of $354 million, a 7.9% increase from $328 million a year ago. The performance benefited from stronger commodity margins and contributions from the Overland Pass Pipeline, although it lagged behind the Zacks Consensus Estimate of $366 million due to lower gathering volumes, which stood at 5.71 billion cubic feet per day (Bcf/d), consistent with the consensus estimate.
Northeast G&P: Adjusted EBITDA for this segment reached $514 million, up from $504 million the previous year and exceeding the Zacks Consensus Estimate by 3.8%. The rise in adjusted EBITDA was driven by increased rates and volumes at Ohio Valley Midstream and higher commodity rates at Laurel Mountain Midstream. Gathering volumes improved to 4.39 Bcf/d from 4.33 Bcf/d a year ago, surpassing the Zacks estimate of 4.31 Bcf/d.
Gas & NGL Marketing Services: This segment reported adjusted EBITDA of $155 million, a decrease from $189 million in the prior year, primarily due to lower natural gas marketing margins. Nonetheless, it surpassed the consensus estimate of $119 million.
Costs, Capex, and Balance Sheet Metrics
In the reported quarter, total costs and expenses reached $1.9 billion, reflecting an 11.1% year-over-year increase.
Total capital expenditures amounted to $1 billion. As of March 31, 2025, Williams held $100 million in cash and equivalents against a long-term debt of $24.1 billion, resulting in a debt-to-capitalization ratio of 61.9%.
2025 Financial Guidance
Williams has revised its 2025 forecast, estimating adjusted EBITDA at $7.7 billion, reflecting a $50 million increase at the guidance midpoint, within a range of $7.5 billion to $7.9 billion. Furthermore, capital expenditure plans for 2025 are set between $2.575 billion and $2.875 billion for growth CapEx and $650 million to $750 million for maintenance CapEx, excluding $150 million earmarked for emissions reductions and modernization projects.
The company’s projected leverage ratio for 2025 is benchmarked at a midpoint of 3.65x, alongside a 5.3% increase in its dividend to $2 per share, up from $1.90 in 2024.
WMB’s Zacks Ranking
Currently, WMB holds a Zacks Rank #3 (Hold). This ranking reflects the company’s stable position in the market.
Earnings Overview
While WMB’s first-quarter results are noteworthy, it is also important to consider other key reports within the oil and gas sector.
For instance, TechnipFMC plc (FTI) reported adjusted earnings of 33 cents per share for the first quarter of 2025, which fell short of the Zacks Consensus Estimate of 36 cents, primarily due to a 4.8% year-over-year rise in costs and expenses. However, this figure did improve from 22 cents in the year-ago quarter, driven by better performance in the Subsea segment. The company’s revenues stood at $2.2 billion, slightly below the Zacks Consensus Estimate but up from $2 billion a year prior.
As of March 31, TechnipFMC had reached an undetermined cash reserve figure.
“`
Oil and Gas Sector Earnings Show Mixed Results in Q1 2025
In the first quarter of 2025, financial results from various oil and gas equipment and services providers revealed a range of performance metrics. Core Laboratories Inc. (CLB) reported adjusted earnings of 8 cents per share, falling short of the Zacks Consensus Estimate of 15 cents. This earnings report also lagged behind the previous year’s result of 13 cents, primarily due to challenges in the Reservoir Description segment.
The company’s operating revenues totaled $124 million, matching the Zacks Consensus Estimate but marking a 4.6% decline from the $130 million reported in the same quarter a year earlier. This revenue decrease stemmed from recent sanctions and operational inefficiencies.
As of March 31, 2025, Core Laboratories held cash and cash equivalents amounting to $22.1 million and had long-term debt of $124.4 million, resulting in a debt-to-capitalization ratio of 32.4%.
Strong Performance from Baker Hughes
In contrast, Houston-based Baker Hughes (BKR) reported adjusted earnings of 51 cents per share, surpassing the Zacks Consensus Estimate of 47 cents and improving from 43 cents in the prior year’s quarter.
At the end of the first quarter 2025, Baker Hughes showcased strong liquidity with cash and cash equivalents of $3.277 billion. Their long-term debt stood at $5.969 billion, giving them a debt-to-capitalization ratio of 25.9%.
These additional insights into the oil and gas equipment and services sector highlight varying performance trends, reflective of broader market challenges and operational dynamics.