Stocks Face Increased Volatility: Key Causes and What Lies Ahead
Investors often seek ways to grow their nominal wealth. Popular methods include buying real estate, investing in Treasury bonds, or purchasing commodities such as gold, silver, and oil. However, stocks have historically outpaced other asset classes over the last century with impressive average annual returns.
Yet, despite stocks being a solid long-term wealth builder, they can experience drastic fluctuations over shorter periods without warning.
Where to invest $1,000 right now? Our analyst team just revealed what they believe are the 10 best stocks to buy right now. Continue »
April’s Market Turbulence and Record Volatility
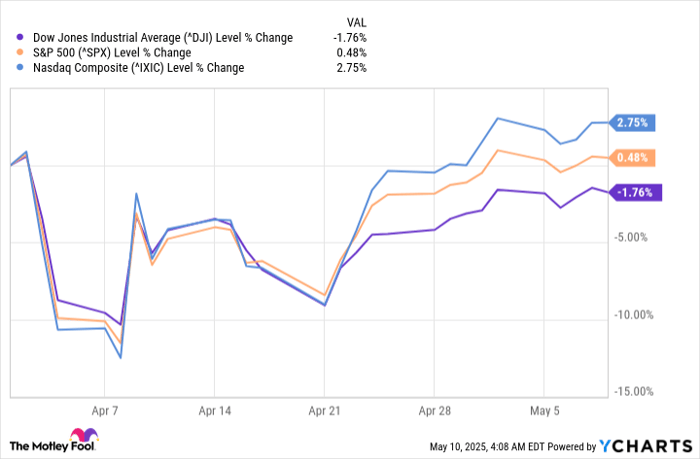
April was a tumultuous month for investors. The Dow Jones Industrial Average (DJINDICES: ^DJI), S&P 500 (SNPINDEX: ^GSPC), and Nasdaq Composite (NASDAQINDEX: ^IXIC) all faced significant downturns, with the Dow and S&P dipping into correction territory while the Nasdaq fell into a bear market. These indexes experienced unprecedented volatility.
Image source: Getty Images.
For example, the S&P 500 faced its fifth-worst two-day percentage drop in 75 years, alongside its 12th-largest four-day decline since 1950. This volatility was quickly followed by record point increases on April 9 for the Dow, S&P 500, and Nasdaq Composite.
As volatility spikes, investors often look to historical metrics and events for guidance, hoping to gain insights into potential market direction. While no correlation can definitively predict future stock movements, some events have shown a strong track record for forecasting subsequent performance.
Anticipating Continued Volatility on Wall Street
Before reviewing a key S&P 500 event that has historically predicted future trends, it’s essential to understand the factors fueling Wall Street’s recent instability—many of which are likely to persist. One significant factor is President Donald Trump’s tariff policy, which has rattled the stock market for various reasons.
On April 2, Trump announced a 10% global tariff along with higher “reciprocal tariffs” on numerous countries with trade deficits with the U.S. Although he announced a 90-day pause on these tariffs for all countries except China on April 9—a day marked by the largest single-day point gain for the major indexes—few trade deals have emerged thus far.
Tariffs pose risks as they can strain trade relations and may lead consumers in other countries to turn away from American products. Additionally, input tariffs could raise manufacturing costs in the U.S., exacerbating inflation concerns.

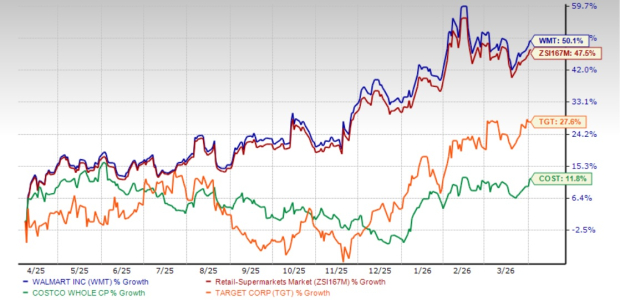
Wall Street’s major stock indexes have experienced a turbulent ride. ^DJI data by YCharts.
Moreover, U.S. economic data is adding to the whipsaw effect on Wall Street. The initial first-quarter gross domestic product (GDP) estimate indicated the U.S. economy contracted by 0.3%. While the stock market doesn’t always move in tandem with the economy, this first contraction in three years suggests that corporate earnings may take a hit.
The high valuation of the stock market is another source of volatility. Slowing corporate earnings growth amid high stock prices creates an unfavorable scenario for investors. In December, the S&P 500’s Shiller price-to-earnings (P/E) ratio reached a high of 38.89, marking only the third instance in 154 years of back-testing where the Shiller P/E exceeded 38. Historically, the average ratio has been about 17.
When the S&P 500’s Shiller P/E has surpassed 30, the market has subsequently lost at least 20% of its value in the five previous instances.
These challenges—Trump’s tariffs, economic uncertainty, and high market valuations—are not expected to dissipate soon.

Image source: Getty Images.
Key S&P 500 Event Signals Future Market Direction
With a clearer understanding of the factors influencing Wall Street’s volatility, let’s focus back on the S&P 500 and its noteworthy event.
Investors are likely familiar with terms like “correction” and “bear market.” A correction occurs when an index falls at least 10% from a previous high, while a bear market refers to a decline of 20% or more from a peak.
However, since 1950, the S&P 500 has experienced numerous corrections that came close to bear market thresholds but never quite reached them. On April 8, the index saw an 18.9% drop from its closing high on February 19. Should this level be identified as the low point, it would represent the eighth occurrence in 75 years where the S&P approached a bear market.
# Historical Market Trends Suggest Potential Recovery After Near Bear Market
Recent analysis reveals that the market faced another near bear market correction, defined as a drop in the 19% range. pic.twitter.com/6pLOw9tRRL
— Ryan Detrick, CMT (@RyanDetrick) May 8, 2025
## Market Responses to Near Bear Markets
The S&P 500’s historical performance following previous near bear markets warrants attention. Ryan Detrick gathered compelling data from FactSet showing that the S&P 500 was higher at one, three, six, and twelve months after the lows of all seven prior near bear markets. This analysis presents a clear pattern across 28 datapoints indicating that the S&P 500 typically rebounds.
Perhaps the most striking statistic is the average return one year post near bear market. While the S&P 500 has averaged a 9.2% annual return since 1950, the average one-year return after hitting the bottom of a near bear market was an impressive 31%. For the last 75 years, corrections within the 15% to 19.9% range have historically foreshadowed substantial investment returns.
## Notable Market Patterns
Detrick’s observations also highlight an unusual trend on Wall Street: the best market days, in terms of percentage gains, often follow closely after the worst days. Notably, the S&P 500’s fifth-worst two-day percentage drop since 1950 was succeeded by its largest nominal point gain and the eighth-largest percentage gain shortly thereafter.
Despite the unsettling nature of market volatility, especially for novice investors unfamiliar with market corrections, such fluctuations are intrinsic to accessing significant wealth opportunities. Savvy investors who maintain perspective can redeem instances of heightened volatility into long-term financial benefits.
## Investment Considerations in Current Market Conditions
Should You Invest $1,000 in the S&P 500 Index Now?
Before deciding to invest in the S&P 500 Index, there are important factors to consider.
The Motley Fool Stock Advisor analyst team has recently identified what they believe to be the 10 best stocks for immediate investment, none of which include the S&P 500 Index. These selected stocks have the potential to deliver significant returns in the coming years.
Consider historical performance: when Netflix made the list on December 17, 2004, a $1,000 investment at that time would now be worth $614,911*! Similarly, a $1,000 investment in Nvidia after its recommendation on April 15, 2005, would have grown to $714,958*.
It’s also relevant to note that Stock Advisor has demonstrated an average return of 907%, significantly outperforming 163% for the S&P 500.
*Stock Advisor returns as of May 12, 2025.
Sean Williams has no position in any of the stocks mentioned. The Motley Fool has positions in and recommends FactSet Research Systems. The Motley Fool has a disclosure policy.
The views and opinions expressed herein are those of the author and do not necessarily reflect those of Nasdaq, Inc.