Wall Street Faces Economic Uncertainty Amid Recession Signals
Recently, Wall Street has had no shortage of catalysts, with the Dow Jones Industrial Average (DJINDICES: ^DJI), S&P 500 (SNPINDEX: ^GSPC), and Nasdaq Composite (NASDAQINDEX: ^IXIC) experiencing a rise over nearly two and a half years. This surge, fueled by advancements in artificial intelligence (AI), has kept investors engaged in 2025. Meanwhile, President Donald Trump’s shifting tariff policies, fluctuations in Treasury bond yields, and renewed enthusiasm for stock splits have added to the market’s complexity. However, it is worth considering whether Wall Street is overlooking the broader economic landscape of the U.S.
Though the economy and stock market do not always align perfectly, corporate earnings tend to correlate with the health of the domestic economy. One recession forecasting tool, which has a strong track record of accuracy since 1959, suggests the U.S. economy and stock market may not be as robust as they seem.
Image source: Getty Images.
Proven Recession Indicators and Their Accuracy
No forecasting tool can precisely predict the future of the U.S. economy or Wall Street. However, certain metrics have historically shown strong correlations with movements in major indices like the Dow, S&P 500, and Nasdaq Composite. A notable driver of economic downturns has been significant declines in M2 money supply.
Currently, the main concern for Wall Street seems less tied to tariff policies and more to what the Federal Reserve Bank of New York’s recession probability tool indicates about the future.
This tool evaluates the yield spread between the 10-year Treasury bond and the three-month Treasury bill to gauge the likelihood of a recession unfolding within the next 12 months. Typically, in a healthy economy, longer-term bonds yield more than short-term bills. A key warning sign occurs when this yield curve inverts, indicating that short-term yields exceed long-term yields, which generally signals investor anxiety regarding the economic outlook.

The only false positive for the New York Fed’s recession probability tool occurred in 1966. U.S. Recession Probability data by YCharts. Gray areas denote U.S. recessions.
As of May 2025, the New York Fed’s forecast indicated a 30.45% chance of a recession by April 2026. While this is an improvement from a high of over 70% in 2023—the highest rate seen in four decades—historical data shows that every probability above 32% since 1966 has eventually led to a recession.
Importantly, prior recessions did not materialize until after the yield curve was restored to a normal upward slope. This pattern, highlighted in the spread comparison of the 10-year and three-month Treasuries, reinforces the potential for an upcoming recession.

10 Year-3 Month Treasury Yield Spread data by YCharts. Gray areas denote U.S. recessions.
Given the recent steep inversion of the 10-year vs. three-month yield curve—the most significant in four decades—it’s reasonable to anticipate a delay in a correction towards normalcy. This adjustment, together with the New York Fed’s tool, suggests that a recession may indeed be on the horizon. Additionally, the first-quarter GDP reading indicated a 0.3% contraction, aligning with the possibility indicated by the Fed’s recession forecasting tool.
A study by Bank of America Global Research shows that around two-thirds of the S&P 500’s peak-to-trough drawdowns from 1927 to March 2023 occurred during U.S. recessions, not in advance of them.

Image source: Getty Images.
Understanding Economic Cycles and Investment Outlook
While it may be disheartening for investors to hear about a potential recession, these economic cycles are normal and expected phenomena. Though recessions typically bring higher unemployment and slower wage growth, they are usually short-lived; historically, the average recession in the U.S. since World War II has lasted just 10 months, without exceeding 18 months.
Conversely, periods of economic expansion tend to last around five years. This inconsistency between growth and contraction explains why, over time, the U.S. economy has displayed considerable growth.
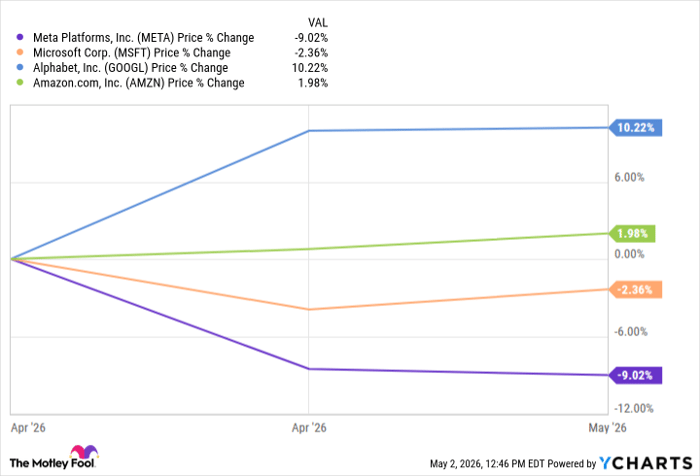
This divergence of expectations is also reflected on Wall Street.
It’s official. A new bull market is confirmed.
The S&P 500 is now up 20% from its 10/12/22 closing low. The prior bear market saw the index fall 25.4% over 282 days.
Read more at https://t.co/H4p1RcpfIn. pic.twitter.com/tnRz1wdonp
# Historical Insights on S&P 500 Bull and Bear Markets
In 2023, analysts at Bespoke Investment Group shared a comprehensive analysis on X, detailing the duration of S&P 500 bull and bear markets since the Great Depression, which began in September 1929.
## Average Bear and Bull Market Durations
The findings revealed that the average bear market in the S&P 500 has lasted 286 calendar days, roughly equivalent to 9.5 months. The longest recorded bear market spanned 630 calendar days during the oil embargo of the 1970s. In contrast, bull markets have shown more resilience, averaging 1,011 calendar days over the past 94 years. If the current bull market continues, 14 out of 27 historical bull markets since 1929 would have persisted longer than the longest bear market.
Given this data, it may not be wise for investors to focus excessively on transient downturns. Historical trends indicate that the U.S. economy and stock market typically thrive, spending most of their time in positive territory.
## Investment Considerations for the S&P 500 Index
Before deciding to invest $1,000 in the S&P 500 Index, it’s essential to evaluate various factors. Analysts from the Motley Fool Stock Advisor have identified ten stocks they believe present better investment opportunities at this time—none of which include the S&P 500 Index. Their analysis suggests these selected stocks could yield significant returns over the coming years.
For example, if an investor had put $1,000 into Netflix on December 17, 2004, based on the Motley Fool’s recommendation, that investment would now be valued at approximately $635,275. Similarly, an investment in Nvidia on April 15, 2005, would be worth around $826,385 today.
It’s important to note that the total average return for the Motley Fool’s Stock Advisor has reached 967%—significantly outperforming the S&P 500’s 171% over the same period.
## Conclusion
As investors weigh their options, they should consider both historical market data and strategic recommendations to make informed decisions. Engaging with a diverse array of investment opportunities may lead to more favorable outcomes than concentrating solely on broad market indices.
*The views expressed in this article are those of the author and do not necessarily reflect the opinions of Nasdaq, Inc.*
5 Stocks Our Experts Predict Could Double In the Next Year
By submitting your email, you'll also get a free pivot & flow membership. A free daily market overview. You can unsubscribe at any time.